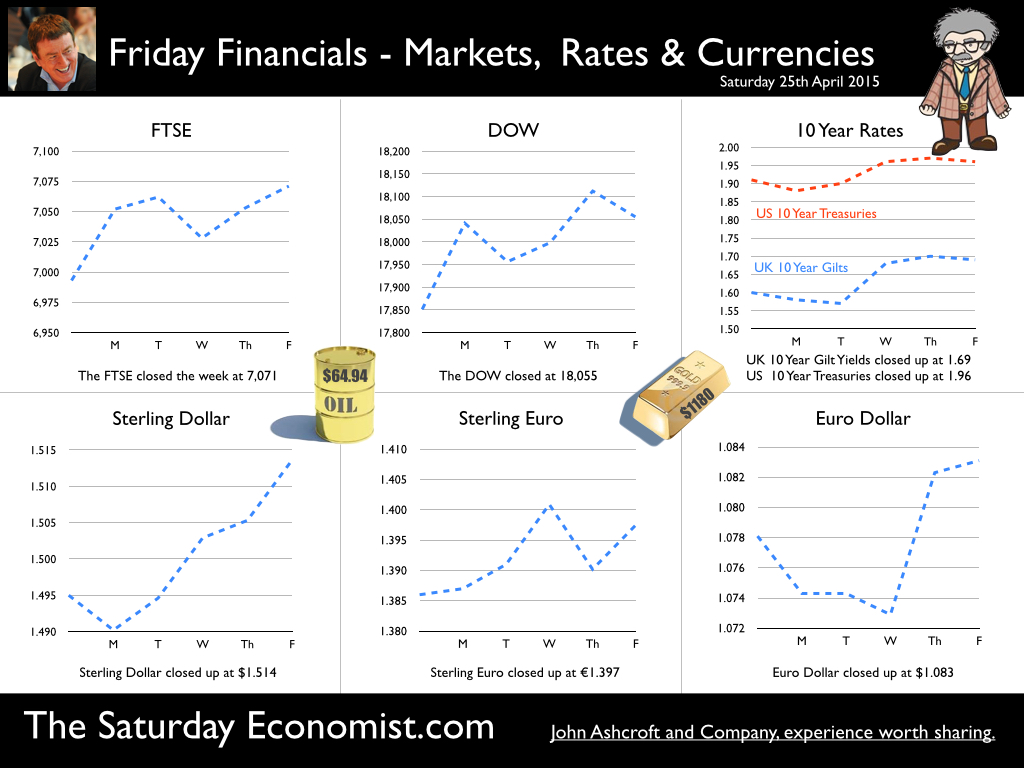
 Good news for the Chancellor this week! Borrowing for the financial year 2014/15 came in at £87.3 billion, down by £11.1 billion on prior year and below the OBR latest estimate. The government is on track to hit the OBR target of £75 billion and below next year. It all came good just in time for the election. Somehow we always thought it would! At the end of March 2015, public sector debt was £1,484.3 billion (81% of GDP), an increase of £82.2 billion compared with March 2014. Government borrowing is 4.8% of GDP and set to fall much further next year and beyond. The Government may well be able to slash borrowing and begin to pay down debt from 2018 onwards. But will it? What happens next, will largely be determined by the outcome of the election. Just a few weeks now and we will be better able to pattern the level of borrowing and debt in the years ahead …! Retail Sales Boom Continues … In other news, retail sales in March increased by 4.2% year on year and by just over 5% in the first quarter of the year. Sales values on the other hand increased by less than 1%. The fall in petrol prices (down 15%) is biasing the overall figures. Retail sales are booming. Department store and non food store sales were up by almost 7% and 5% respectively. Household good stores sales were up by over 11%, with the average spend increasing by over 7%. Food sales increased by 3.5% with values up by less than 1%. Retailers hate the scenario of more volume and work with diminished margin. It remains tough for the big four. Online sales increased by over 10% year on year, accounting for almost 12% of all sales activity. Omni channel with mobile connectivity, the new mantra in the high street and beyond … Car Production … This week, the Society of Motor Manufacturers and Traders released the latest data on UK car manufacturing. Production increased by 2% in March with 144,893 cars built – the best March since 2006. Productivity is increasing ... In fact productivity in car manufacturing is at an all-time high. Over the past five years, 11.5 vehicles were produced a year for each person employed in the industry. For the period from 2005 to 2009, the figure was just 9.3 vehicles produced per employee per year. So how does the relate to the ongoing drama about the lack of productivity in the UK? The answer is pretty simple. Last week we published our Analysis of Productivity Trends in the UK, using data for thirty sectors over the past fifty years. Transport has the highest rate of productivity across all sectors ... The SMMT data confirms this trend. But growth in transport output, is below the overall level of output in the economy. Stronger growth in private sector services, is determining the apparent decline or lack of growth in UK productivity. In the service sector, productivity growth is half that of manufacturing and in certain sectors it is near unity. So much of the job growth has been in sectors with low rates of productivity growth. In the service sector, we should think of productivity as an output of growth and not a driver of growth. When restaurants, hotels, pubs, distribution centres, delivery services and retail are busy, productivity rises. Conversely when they are not, output per capita falls as does apparent productivity. As the economy continues to recover and the level of activity increases, something will turn up. It will be UK productivity. And what of the international comparison … It is suggested that UK productivity is some 20% below the levels of Germany, Italy and Italy! What nonsense this is! It is to compare Äpfel und Orangen, Pommes et Oranges, Mele e Arance. Manufacturing in Germany is over 20% of GDP, just over 15% in Italy and about 10% in France. We would expect a higher rate of productivity in both German and Italy as a result. But the big question is “What exchange rate did they use”? If Sterling is weak against the Euro, productivity in Europe will appear to be higher. If the Euro is weak against Sterling, productivity in Europe will appear to be lower. So what exchange rate did they use? The ONS used the OECD Purchasing Power Parity Values last updated in 2013. They could have used The Economist Big Mac Index, it could have done the job just as well! Had the average Euro values between 2005 and 2008 been used (€1.45), Italian productivity would appear to be lower than the UK. German productivity measured as GDP per worker would be 9% below that of their UK counterparts! Ah yes the slothful indolence of the average German worker, toiling in the miracle Mittelsand for so little effect. Was is los? We ask with a smile. International comparisons of productivity offer spurious accuracy which should be used with extreme caution, especially in Manchester. Wir sind nicht Berliners! So what of rates? Markets still believe the Fed will begin to increase rates in Q3 this year. Once the Fed makes a move, the MPC will surely follow. We could be leaving Planet ZIRP before Christmas …. Buckle up! So what happened to Sterling this week? Sterling moved up against the Dollar to $1.514 from $1.4595 and moved up against the Euro to €1.397 from €1.386. The Euro rallied against the Dollar at €1.083 from €1.078. Oil Price Brent Crude closed at $64.94 from $63.89. The average price in April last year was $107.76. The deflationary push continues. Our forecasts of a $75 - $80 recovery, no longer so far fetched. Markets, moved back above the magic marks. The Dow closed at 18,055 from 17,851and the FTSE closed above 7,000 at 7,071 from 6,993. UK Ten year gilt yields moved up to 1.69 from 1.60. US Treasury yields moved up, to 1.96 from 1.91. Gold slipped to $1,180 ($1,204). That’s all for this week. Don’t miss The Big Social Media Conference in July and The Great Manchester Economics Conference in October. It’s a great line up for all events! The Saturday Economist - now mailing to 50,000 businesses every month! John © 2015 The Saturday Economist by John Ashcroft and Company : Economics, Corporate Strategy and Social Media ... Experience worth sharing. The material is based upon information which we consider to be reliable but we do not represent that it is accurate or complete and it should not be relied upon as such. We accept no liability for errors, or omissions of opinion or fact. In particular, no reliance should be placed on the comments on trends in financial markets. The receipt of this email should not be construed as the giving of investment advice.
0 Comments
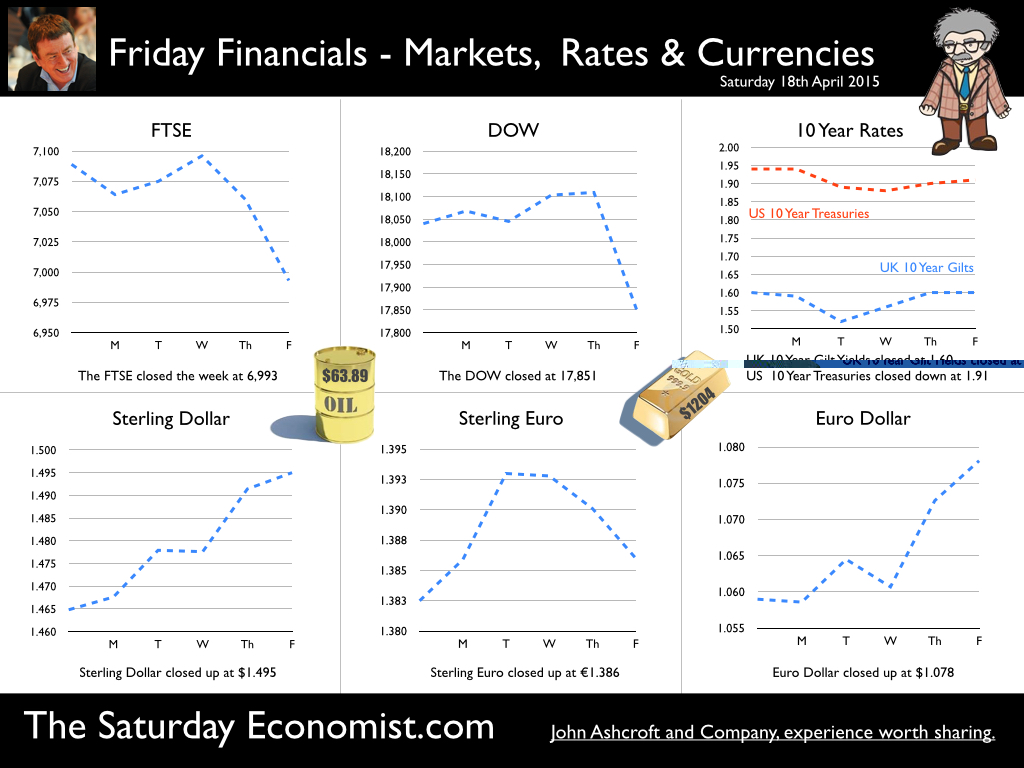
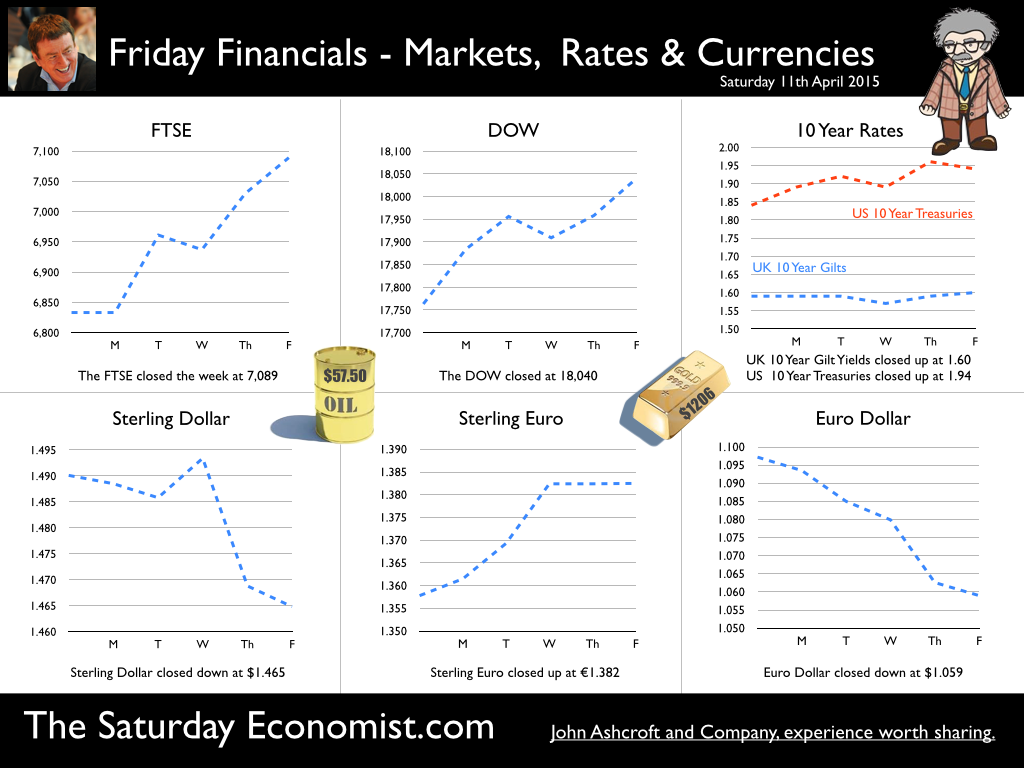
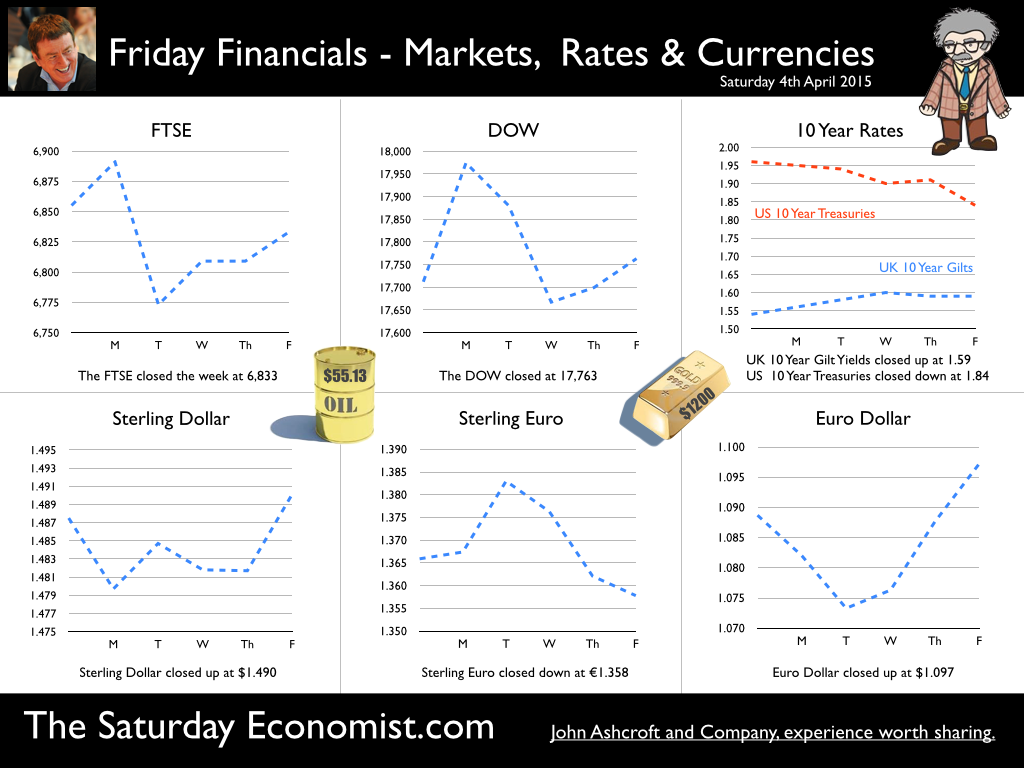
 It was a tough start to the week. Breakfast TV, on Monday morning, to explain the UK productivity dilemma. It was a three minute slot, demanding over three hours of research on Sunday afternoon. Excellent! I thought I would share some of the main points in today's update ... So what’s the problem …? According to the latest data from the ONS, labour productivity last year was little changed from 2013. It was slightly lower than in 2007. Productivity is lower than the period prior to the economic downturn. In fact there has been an absence of productivity growth over the last seven years. The trend is unprecedented since the post-war period. If the lack of productivity growth continues, this raises concerns about the potential rate of growth of the UK economy in the years ahead. The UK economy will be unable to grow at trend rate (2.7%) because of constraints to productivity. It is said! But is that really the case? The UK economy is growing above trend rate. Jobs are being created at an unprecedented rate. Businesses are investing, profits are soaring. So what is the problem? Why has productivity been falling over the last fifty years …? For the research, we analysed the data, using estimates of labour productivity in thirty sectors back to 1948. Productivity has been falling over the last fifty years. To understand why it is important to understand the sectoral adjusted trend rate of productivity. So what does that mean exactly … Manufacturing delivers a higher rate of productivity than the service sector. Transport (wheels and wings) deliver a much higher rate of productivity growth than leisure (hotels and restaurants). As the UK becomes more of a service sector economy (and manufacturing falls as a share of output) the overall rate of productivity will fall. The growth of the service sector will mean the overall rate of productivity growth falls over time. Our estimate of the UK sectoral adjusted productivity rate of growth, is just 1.6% compared to an historical trend rate of 2.24%. Why has productivity not been increasing during the recovery …? Almost all of the job creation over the last year has been in the service sector. Particularly in leisure, hotels and restaurants. The productivity gain is near zero. In the manufacturing sector with a exposure to international markets, Productivity is important as a Key Performance Indicator (KPI). But it is not so important in the service sector. In the service sector, service is the KPI. Can waiters serve more tables? Housekeepers clean more rooms? Retailers cut staff without increasing queues at check out? Restaurants and coffee bars, are labour intensive. As chains expand, output improves but expansion does not offer great returns to scale, as would investment in plant and machinery. What really makes the difference to productivity? The level of output. More people spending money in pubs, restaurants, hotels and coffee shops. As demand grows, output increases, productivity improves. The UK economy is growing above trend rate but the level of output is still some 10% below the level which would have been achieved, had there been no setback in 2008. Does this explain the productivity dilemma? In part yes! The cyclically adjusted trend rate of productivity … Traditionally economists think of productivity as a driver of growth. Output as a function of labour, capital and productivity. It is called Total Factor Productivity in a Cobb Douglas framework. [It makes me smile. It is to prepare a Beef Stew beginning with the recipe for nail soup. The nail plays a role but much more is involved.] It is true, as we explain in the research, there is significant correlation between growth and productivity. But as in all correlations, we have to differentiate between cause and effect. We should think of productivity, not as a driver of growth but as a simple output of growth. An arithmetical calculation. A function of output divided by labour, delivering the productivity calculation. As output increases, productivity increases. As output falls, productivity falls. Productivity in the service sector … In the manufacturing sector with an exposure to international markets, productivity is important as a Key Performance Indicator (KPI). But is it so important in the service sector, where service is the KPI. Can waiters serve more tables? Housekeepers clean more rooms? Retailers cut staff without increasing queues at check out! The man in the van explains all. Our man in the van, is part of a national fleet delivery service. The next day delivery promise, demands a national fleet with a national team of drivers to keep the vehicles on the road. At the beginning of 2008, order books and the vans were full. Productivity was high. In 2008, the orders fell as did the loads in the back of the van. The productivity of our man in the van fell. It has not made a full recovery since. His productivity is improving but is not yet back to pre recession levels. The vans keep rolling, no matter how big the load in the back! We say, don’t worry too much about UK productivity. Understand the Saturday Economist concept of a sectoral and cyclically adjusted trend rate of growth of productivity. The man in the van helps to explain all. As the economy continues to grow, something will turn up. It will be UK productivity. For a copy of the PDF and the charts associated with this analysis - check out the page link, access and download the detail. So what of other news this week ... Inflation held at 0.0%. Service sector inflation increased at 2.5% and manufactured goods inflation fell by -2.1%. The employment data produced another set of strong results. Vacancies increased to 745,000 and the claimant rate fell 772,000. Next month there will be more vacancies than claimants. No wonder recruitment difficulties are increasing! Earnings are unlikely to remain at the sub 2% level for long! Over the last year, 600,000 more people are in work. The vast majority now in full time employment, in the service sector! So when will rates rise? With some evidence US inflation is edging up, markets still believe the Fed will begin to increase rates in Q3 this year. Once the Fed makes a move, the MPC will surely follow. We could be leaving Planet ZIRP before Christmas …. Buckle up! So what happened to Sterling this week? Sterling moved up against the Dollar to $1.4595 from $1.465 and moved up against the Euro to €1.386 from €1.382. The Euro rallied against the Dollar at €1.078 from €1.059. Oil Price Brent Crude closed up at $63.89 from $57.50. The average price in April last year was $107.76. The deflationary push continues for the moment. But watch out, our forecasts of a $75 - $80 oil price recovery, no longer so far fetched. Markets, could not hold the magic marks. The Dow closed at 17,851 from 18,040 and the FTSE closed just below 7,000 at 6,993 from 7,089. UK Ten year gilt yields held at 1.60. US Treasury yields moved down to 1.91 from 1.94. Gold closed steadied at $1,204 ($1,206). That’s all for this week. Don’t miss The Big Social Media Conference in July and The Great Manchester Economics Conference in October. It’s a great line up for all events! The Saturday Economist - now mailing to 50,000 businesses every month! John © 2015 The Saturday Economist by John Ashcroft and Company : Economics, Corporate Strategy and Social Media ... Experience worth sharing. The material is based upon information which we consider to be reliable but we do not represent that it is accurate or complete and it should not be relied upon as such. We accept no liability for errors, or omissions of opinion or fact. In particular, no reliance should be placed on the comments on trends in financial markets. The receipt of this email should not be construed as the giving of investment advice.  Manufacturing and construction data suggest slower growth in Q1 … This week the ONS released the latest data on trade, construction and manufacturing for the month of February. For a Chancellor of the Exchequer just weeks away from election, it was not great news … The trade deficit increased, the march of the makers slowed to a stroll and construction workers walked backwards. The data must have created some doubt in Downing Street about the platform for the polls. The first estimate of GDP for the first quarter will be released on the 28th of April. Days from the deafening roar of the electorate, strategists will be reminded of the dodgy trade data costing Harold Wilson the election in 1970. It’s the economy stupid and it ain’t going as well as we thought! Or is it? So how bad can it be …? The week had started well enough. The Markit/CIPS PMI® data for March suggested growth in the service sector accelerated in March. The index rose to 58.9 from 56.7 in February, a marked pace of expansion - the fastest since August 2014. For the first quarter, growth was estimated to be faster than the 3.4% rate achieved in the final quarter of last year. It was all going so well … Then came the trade data … The trade data dashed hopes of the rebalancing agenda. The deficit increased in February from prior month. The UK deficit on trade in goods and services increased to £2.9 billion in February 2015, from £1.5 billion in January. A deficit of £10.3 billion on goods, was partially offset by an estimated surplus of £7.5 billion on services. The widening of the trade deficit between January and February 2015 mainly reflected a fall in exports of goods to the United States. Imports, on the other had, were exactly in line with our forecasts. Whilst some commentators suggested the deficit was a signal of lower UK growth, the reality is quite the reverse. Strong import growth is a reflection of strong growth in domestic demand plus the February export setback is more anomaly than trend. We expect the deficit trade in good to be between £123 billion for the current year with an overall goods and services deficit of around £35 billion. Nothing changes over much with the February release. Then came the manufacturing data … ONS data suggested output in the manufacturing sector slowed to 1.1% in February. Growth for January was revised down to 1.7%. We had expected growth of 2.5% in the first quarter but now 1.5% looks to be a better bet. The good news, there were increases in nine manufacturing sub-sectors compared with a year ago. The largest contribution from the manufacture of cars and transport, up by 6.1%. The overall fall in the rate of growth is difficult to explain and data may well be revised in the months ahead. Then came the construction data … According to the ONS, output in construction fell by 1.3% in February and by 3% in January. Output will probably fall by around 1.5% for the full quarter, if the latest data are to be believed. We had expected much stronger growth. [Construction output increased by 7.5% in 2014 with growth slowing to 4.5% in the final quarter]. We still expect construction output to increase by 5% for the year as a whole but we shall see … So what of growth Q1 … Following the latest data, we now expect growth of 2.5% in the first quarter down from an earlier 3% estimate. NIESR estimate growth in the first quarter will be around 2.6% year on year. Although slower than the 3% recorded in the final quarter last year, it is respectable, given trends in Europe and the USA. Next month we will update our Quarterly Economic Outlook … don’t miss that! So when will rates rise? Markets still believe the Fed will begin to increase rates later this year. Minutes from the Fed meeting haven’t changed expectations over much. Q3 now the firm favourite following the slight downward growth revisions for 2015 and sluggish jobs growth data in March released last week. In the UK the forward OIS curve suggests markets still expect rates to rise in the first or second quarters of 2016. The wait may not be so long … especially if markets take fright. In the UK, we still expect growth of around 3% this year. The labour market is tightening, recruitment difficulties are increasing, wage rates and settlements are set to rise. The inflation outlook will be materially different towards the end of the year. Once the Fed makes a move, the MPC will surely follow within the year …. So what happened to Sterling this week? Sterling slipped against the Dollar down to $1.465 from $1.490 but moved up against the Euro to €1.382 from €1.358. It was all about the Euro this week, heading in the wrong direction. The Euro closed down against the Dollar at €1.059 from €1.097. The push to parity resumed. Oil Price Brent Crude closed up at $57.50 from $55.13, despite the Gatwick find. The average price in April last year was $107.76. The deflationary push continues. Markets, moved above the Magic Marks. The Dow closed up 18,040 from 17,763 and the FTSE closed above 7000 at 7089 from 6,833. UK Ten year gilt yields also moved up - to 1.60 from 1.59. US Treasury yields moved up to 1.94 from 1.84. Gold closed up at $1,206 ($1,200). That’s all for this week. Don’t miss The Big Social Media Conference in July and the Great Manchester Economics Conference in October. It’s a great line up for all events! On Monday we will be on TV to explain the UK productivity dilemma to the BBC Breakfast audience. The Saturday Economist, now the TV Economist is mailing to 50,000 businesses every month! John © 2015 The Saturday Economist by John Ashcroft and Company : Economics, Corporate Strategy and Social Media ... Experience worth sharing. The material is based upon information which we consider to be reliable but we do not represent that it is accurate or complete and it should not be relied upon as such. We accept no liability for errors, or omissions of opinion or fact. In particular, no reliance should be placed on the comments on trends in financial markets. The receipt of this email should not be construed as the giving of investment advice.  Strong growth revisions suggest rates will have to rise this year … This week, the ONS released the latest data on the Quarterly National Accounts. It was heady stuff. Growth in the final quarter of 2014 was revised to 3% and growth for the whole of 2014 was revised up to 2.8%. There may well be further revisions to come over the next six months, pushing the growth rate for the year as a whole to 3%. Is this important? Well yes. It marks a period of above trend growth. “Periods above trend, come to an end”, usually marked by a switch in monetary policy. 50 basis points and 3% growth do not make for a stable expansion. For the moment, inflation (or lack of it) is always and everywhere an international phenomenon. Markets may believe UK rates will be on hold into 2016. With headline inflation at 0.0%, talk of a rate rise may appear to be premature but last week Mark Carney made it clear, the next move in UK base rates will be up. No forward guidance as to when exactly! Service sector inflation and growth is above target and trend rate … In the UK, service sector inflation is above target rate. The jobs market is tightening (more vacancies than claimants by the time of the election). Wage rates and earnings are set to rise by the end of the year. In the UK service sector growth is above trend rate. Private service sector growth in leisure, distribution and business services increased by almost 4%. Service sector growth continues to drive recovery. Overall service sector growth was 3%. Manufacturing output increased by 2.9% and construction increased by a massive 7.4%. Domestic demand increased by 3.3% over the past year. Household spending increased by 2.5% and investment increased by an impressive 7.8%. Imports increased at a much faster rate than exports. The imbalance - a simple function of relative demand in domestic and export markets. So what of 2015 ... ? Next month we produce our Quarterly Economic Outlook Q2 following release of the ONS preliminary estimates for the first quarter. For the moment we have updated the Q1 forecasts with an April update. Really not much has changed. We think the growth rate and direction of the UK economy will continue from the pattern established in 2014. We forecast growth up 2.9% to 3%, with a strong performance in the service sector (3.1%), construction (5.5%) and manufacturing (2.5%). Household spending will increase by 2.6%. Investment growth with slow to 5.5%. Domestic demand growth will slow to 2.6%. Exports will increase by 2.6% as the European recovery continues. But once again imports will increase at a faster rate (2.9%) than imports. Concerns about 2015 ... ? There have been some concerns about growth in the first quarter following the latest data on manufacturing and construction. Manufacturing growth increased by just 2% in January. Construction growth, up by just 3% cast doubt about the recovery in the housing market. The construction data, beset as it is by some SAD (Seasonal adjustment deficiency ) disorder), will be revised up in future releases. The strong growth in service sector continued in January. Service sector growth increased by 3.2% with growth in leisure, distribution and business services up by 4.2%. The latest PMI Markit survey data, continues to suggest strong growth in the March data. We remain confident about the growth forecast notwithstanding the election uncertainty, pre and post the ballot date. Election jitters will freak markets. Financial markets will react badly to the prospect of a Labour SNP coalition. The twin deficit dilemma would be manifest. An external current account deficit and an internal borrowing requirement of around 5% of GDP do not for stable markets make. Rates may have to rise to defend a currency under threat from international speculators putting pressure on the pound in your pocket! So when will rates rise ... ? Markets still believe the Fed will begin to increase rates later this year. Q3 now the favourite following the slight downward growth revisions for 2015 and the sluggish jobs growth data in March released this week. In the UK the forward OIS curve suggests markets still expect rates to rise in the first or second quarters of 2016. The wait may not be so long … especially if markets take fright. In the UK, we expect growth of around 3% this year. The labour market is tightening, recruitment difficulties are increasing, wage rates and settlements are set to rise. The inflation outlook will be materially different towards the end of the year. We say again, once the Fed makes a move, the MPC will surely follow within the current year …. It really is time to leave Planet ZIRP. Business should begin to book their flights and plan accordingly … So what happened to Sterling this week? Sterling rallied against the Dollar up $1.490 from $1.487 and moved down against the Euro to €1.358 from €1.3660. It was all about the Euro this week. The Euro closed up against the Dollar at €1.097 from €1.089. The push to parity postponed or probably abandoned Oil Price Brent Crude closed down at $55.13 from $56.41. News from Iran pushed prices lower. The average price in April last year was $107.76. The deflationary push continues. Markets, settled. The Dow closed at 17,763 from 17,712 and the FTSE closed down at 6,833 from 6,855. UK Ten year gilt yields moved up to 1.59 from 1.54. US Treasury yields moved up to 1.84 from 1.96. Gold closed up at $1,200 ($1,198). That’s all for this week. Don’t miss The Big Social Media Conference in July and the Great Manchester Economics Conference in October. It’s a great line up for all events! The Saturday Economist, now mailing to 50,000 businesses every month! John © 2015 The Saturday Economist by John Ashcroft and Company : Economics, Corporate Strategy and Social Media ... Experience worth sharing. The material is based upon information which we consider to be reliable but we do not represent that it is accurate or complete and it should not be relied upon as such. We accept no liability for errors, or omissions of opinion or fact. In particular, no reliance should be placed on the comments on trends in financial markets. The receipt of this email should not be construed as the giving of investment advice. |
The Saturday EconomistAuthorJohn Ashcroft publishes the Saturday Economist. Join the mailing list for updates on the UK and World Economy. Archives
July 2024
Categories
All
|
| The Saturday Economist |
The material is based upon information which we consider to be reliable but we do not represent that it is accurate or complete and it should not be relied upon as such. We accept no liability for errors, or omissions of opinion or fact. In particular, no reliance should be placed on the comments on trends in financial markets. The presentation should not be construed as the giving of investment advice.
|
The Saturday Economist, weekly updates on the UK economy.
Sign Up Now! Stay Up To Date! | Privacy Policy | Terms and Conditions | |
 RSS Feed