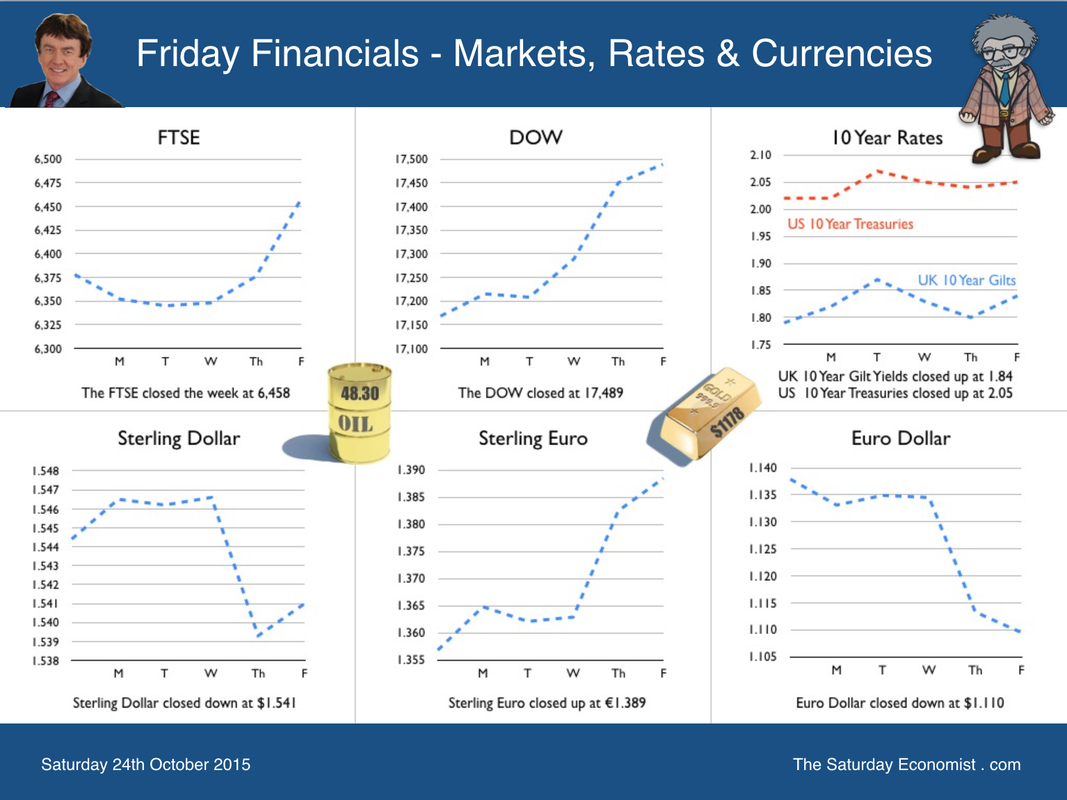
 It isn’t every night you get to sleep next door to the President of China. This week President Mr Xi Jinping and Madame Peng Liyuan, were staying at the Lowry Hotel in Manchester, so close. Security intense. helicopters in the sky, dinghies in the river. The walkway bridge over the Irwell closed to passenger traffic and hi vis jackets ubiquitous. The red carpet was out and not just for an important wedding later today. The Silk Road to Wigan Pier has opened, the extension to the West complete. Orwell would have been thrilled. As indeed we should all be. The Chinese are coming, visas permitted and want to invest in the Northern Powerhouse. Chinese Foreign investment is measured in terms of ATM - Access to markets, ATT - Access to Technology and ATR - access to resource. For China the UK is important, not because of markets, technology or resource. Deals on nuclear energy and hi speed rail benefit both. The acquisition of trophy assets like Weetabix and Hamlets flatter. The UK has a revealed comparative advantage in financial services which China seeks to mirror and develop in the years ahead. London as a trading centre for the Renminbi, important for both countries, Britain’s engagement in the Asian Infrastructure Investment Bank, a real prize for the Chinese and for the UK. China is embracing Britain to provide a financial bridgehead in the West. “The UK is the leading offshore trading centre, outside of Hong Kong” President Xi told parliament this week. China seeks to internationalise the Yuan securing a place in the IMF SDR basket. It will one day replace the Dollar as the dominant currency but not just yet. The Bank of England was the first G7 central bank to sign a swap agreement with the Central Bank of China. The first Chinese sovereign bond, worth over $4 billion, was issued this week in London. It is a significant step. This is the start of the “Golden Era” between the UK and China. The Middle Kingdom is returning to the world stage with a policy of benign hegemony. Lest we forget, in 1820, China accounted for one third of world GDP with the largest population (37%) on the planet. Over one hundred years were then lost to foreign invasion, sequestration, famine and pestilence. In the West we have the audacity to lecture on human rights, conveniently forgetting 19th century Opium wars were fought to dump surplus drug stock from the East India Company, in the largest market on earth, in exchange for tea, silks and porcelain. Much cheaper than silver and much more addictive. The lost output worth $ Quadrillions. The potential for China remains huge. 1.3 billion population, with $3.5 trillion of international reserves - the second largest economy in the world. Yet in terms of GDP per capita, the country still struggles amongst the top eighty in the world, such is the challenge remaining, a guide to the growth potential. The new five year plan, out soon, may reveal a lower GDP target growth target of 6.5%. This is a moderate slowdown with little or no chance of a hard landing. Too often we look from the West with eyes conditioned by Stop Go policies stimulating cycles of Boom and Bust. It is a mistake. Lessons from history suggest the Middle Kingdom is returning to a rightful place on the world stage. The potential is awesome still. So what happened in the UK this week … Retail sales in September were up by 6.5% compared to prior year. Beer swilling, curry eating rugby hordes attending the world cup, may have boosted takings in the month. There is no doubt, a strong jobs market, with improving earnings is boosting consumer confidence and household spending. This is the year of the Lilies, with low interest, low inflation and an earnings surge. It won’t get much better than this. On line sales were up by 15%, retail values increased by 2.7%. Base rates at 50 basis points the anomaly against the strong retail sales performance. Time for the MPC to get ahead of the curve. Government Borrowing … Good news for The Chancellor this week as borrowing in September fell to £9.4 billion from £11.0 billion prior year. For the year to date borrowing was down by £7.5 billion as revenues increased by 4% and expenditure wass contained at or around 1%. For the year as a whole, the target is £69.5 billion from £90 billion last year. Our forecast would suggest £73 billion is the current marker but the overall reduction task remains feasible given the strength of income growth and domestic demand. It would be a great achievement pushing borrowing to around 3.5% of GDP. The spending round and the full tax credit programme may be more difficult to justify politically as the economy continues to recover well and the Treasury coffers benefit. So what happened to Sterling this week? Sterling moved down against the Dollar to $1.541 from $1.544 but moved up against the Euro to €1.389 from €1.357 The Euro moved down against the Dollar at €1.110 from€1.138. Oil Price Brent Crude closed at $48.30 from $50.33. The average price in October last year was $87.43. The deflationary push continues. Markets, up this week! The Dow closed at 17,489 from 17,168. The FTSE closed up at 6,458 from 6,378. Gilts - UK yields moved up. UK Ten year gilt yields were at 1.84 from 1.79. US Treasury yields moved to 2.05 from 2.02. Gold moved to $1,178 ($1,181). John © 2015 The Saturday Economist by John Ashcroft and Company : Economics, Corporate Strategy and Social Media ... Experience worth sharing. The material is based upon information which we consider to be reliable but we do not represent that it is accurate or complete and it should not be relied upon as such. We accept no liability for errors, or omissions of opinion or fact. In particular, no reliance should be placed on the comments on trends in financial markets. The receipt of this email should not be construed as the giving of investment advice.
0 Comments
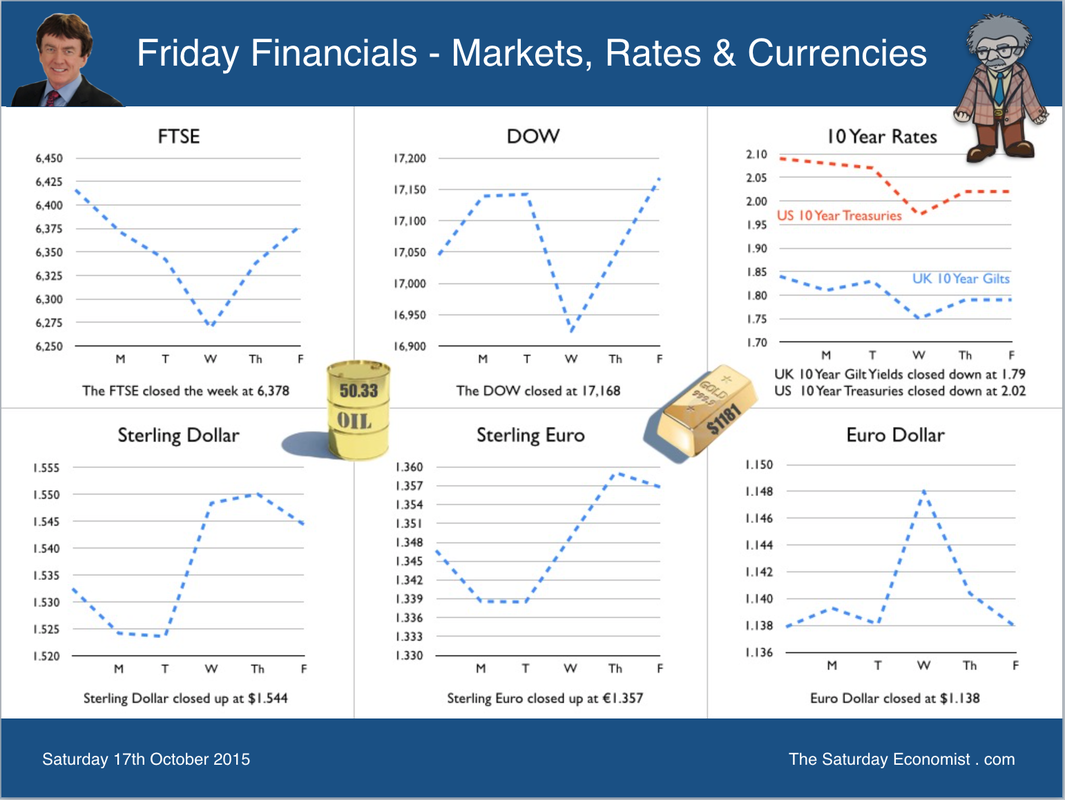
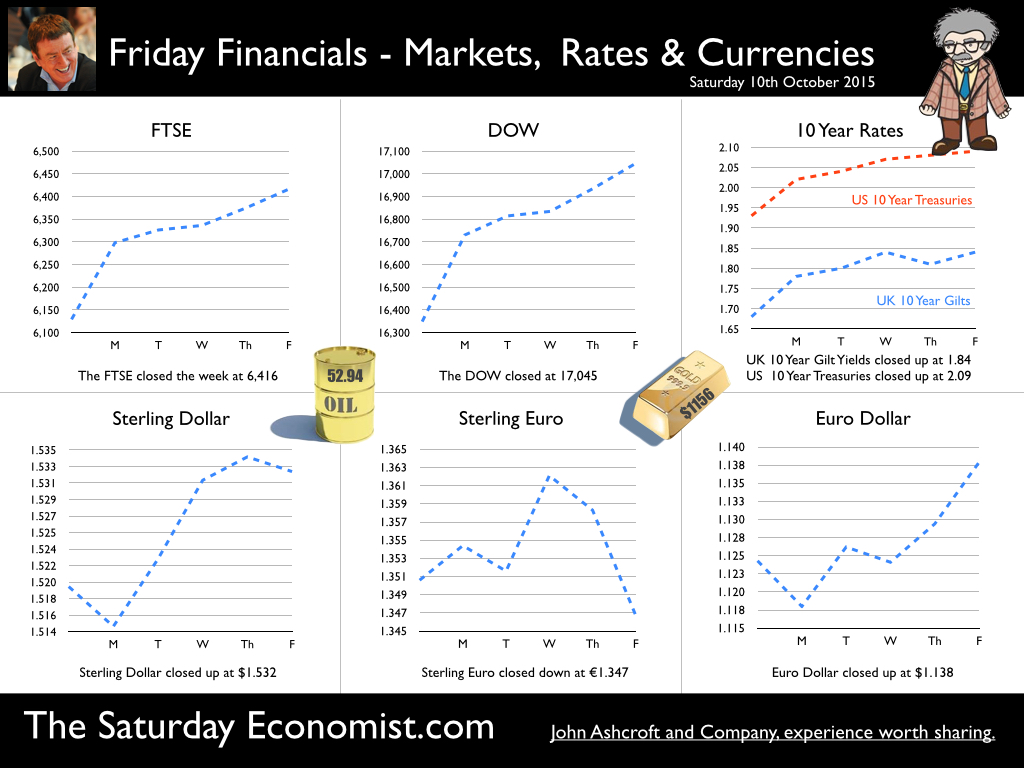
 It isn’t supposed to be like this. Inflation is falling but so is unemployment. The jobs market is tightening with no discernible impact on inflation. The Monetary Policy Committee has mixed views on the need to tighten monetary policy. Has the relationship between unemployment and inflation broken down? Based on data over the past ten years, correlation is weak and incorrectly signed. Inflation appears to increase as unemployment increases. It really isn’t supposed to be like this. No wonder policy makers appear confused. So what of earnings and employment … The relationship between employment and earnings remains strong. Especially the relationship between real earnings and employment. Earnings and real earnings increase, as unemployment levels fall. The impact of inflation on real earnings is negative. As inflation rises, real incomes fall. As inflation falls, real incomes rise. The trade off is a by product. There is little or no inflation anticipation in the wage round. So what of earnings and inflation … The correlation between earnings and inflation is weak. Earnings rise but with no discernible impact on inflation. No wonder the MPC is loathe to act. Inflation is no longer a function of the Phillips Curve nor is it always and everywhere a monetary phenomenon. For the moment inflation is always and everywhere an international phenomenon. It’s about the strength of Sterling, the weakness of international trade, commodity and energy prices impacting on domestic price levels. But it won’t always be like this. At some stage, the strength of household expenditure and domestic demand fueled by high employment and rising earnings will impact on prices and the trade deficit. Then the MPC will have to act. Rate increases will rise more quickly and higher than is currently expected as a result. Implications for policy … Service sector inflation is above target, earnings are increasing especially in construction and the leisure sector. Real earnings adjusted for inflation are back at levels last seen pre recession. The jobs market is at levels last seen in 2008. The headline level of inflation is creating an illusion driven by low oil and commodity prices. A change in OPEC policy and a change in Sterling’s fortunes could see inflation increasing and quickly in 2016. Monetary policy could be the real basket case in 2016 unless rates begin to rise and soon. It really is time to consider the first move up in rates. So what happened to inflation … Inflation CPI basis fell by 0.1% in the year to September 2015, compared 0.0% in the year to August. A smaller than usual rise in clothing prices and falling motor fuel prices were the main contributors to the drop. Goods inflation pushed down the overall value, falling by -2.5% in the same period. Service sector inflation on the other hand was above target at 2.5% in the month, up from 2.3% in August. Inflation manufacturing prices … Factory gate inflation fell 1.8% in the year to September 2015, compared with a fall of 1.9% last month. Input costs for manufacturing fell by -13.3% compared to almost 15% month prior. Crude oil and imported metal prices were the major contributors to lower costs presenting a confusing picture for policy makers. Labour Market Trends … The economy continues to grow strongly as the latest jobs figures demonstrate. The unemployment rate in August fell to 5.4%, compared to 6% a year earlier. It has not been lower since early 2008. There were just 1.77 million unemployed people, 198,000 fewer than a year earlier. The claimant count fell to just over 700,000 in August a rate of 2.3%. Vacancies were steady at around 740,000. The U:V ratio i.e. the rate of claimants to vacancies was just 1.08 in line with trends at peak, immediately prior to the recession. Earnings continue to rise as the job market tightens. Average earnings increased to 3.1% in the month. Private sector pay increased by 3.5% with particularly high increases in construction (6.4%) and leisure (5.1%). The labour market is tightening, recruitment difficulties are increasing and household incomes are improving. Adjusted for inflation, real earnings are back to pre recession levels. No wonder households are confident and are spending. So what of oil prices … North Sea Brent crude oil prices averaged $48 per barrel in September. EIA forecasts Brent crude prices will average $54 dollars per barrel in 2015 and just $59 per barrel in 2016, according to the latest Short Term Economic Outlook. If prices do hover around the $54 mark, the deflationary impact will evaporate by the end of the year and into 2016. Energy costs could be rising by over 10% year on year as early as January. So what happened to Sterling this week? Sterling moved up against the Dollar to $1.544 from $1.532 and moved up against the Euro to €1.357 from €1.347 The Euro was unchanged against the Dollar at €1.138. Oil Price Brent Crude closed at $50.33 from $52.94. The average price in October last year was $87.43. The deflationary push continues. A $75 - $80 recovery by Q4 remains the base case in our outlook forecast. This appears unrealistic against the EIA forecast and the OPEC stance on output. Markets, up this week? The Dow closed at 17,168 from 17,045. The FTSE closed down at 6,378 from 6,416. Gilts - UK yields slipped. UK Ten year gilt yields were at 1.79 from 1.84. US Treasury yields moved down to 2.02 from 2.09. Gold moved up to $1,181 ($1,156). John © 2015 The Saturday Economist by John Ashcroft and Company : Economics, Corporate Strategy and Social Media ... Experience worth sharing. The material is based upon information which we consider to be reliable but we do not represent that it is accurate or complete and it should not be relied upon as such. We accept no liability for errors, or omissions of opinion or fact. In particular, no reliance should be placed on the comments on trends in financial markets. The receipt of this email should not be construed as the giving of investment advice. 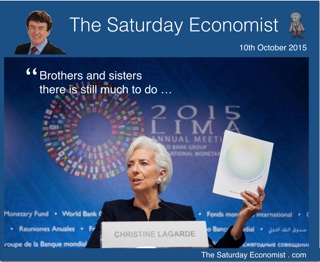 Brothers and Sisters, there is still much to do … Christine Lagarde head of the IMF was in Peru this week. The latest update from Washington had been pretty gloomy. Growth in 2015 had been down graded to 3.1%, the lowest since the financial crisis. The warning was of a clear and present danger to emerging markets, from the imminent monetary policy adjustment in the West. Larry Summers, Harvard Professor and former advisor to President Obama pulled no punches. The global economy is in serious danger screamed the headline in the Washington Post on Wednesday. “The problem of secular stagnation is growing worse in the wake of problems in most big emerging markets, starting with China” he said. If only we knew what secular stagnation is, we might be able to do something about it. It’s two random words thrust together as a revamped Keynesian Liquidity Trap. To suggest the dangers facing the global economy are more severe than at any time since the Lehman Brothers bankruptcy in 2008 is exaggerating the problem to grab a headline. Not for the first time this year Professor Summers has cried Wolf. Not to worry. Christine Lagarde, is on the case. Quoting the Peruvian poet César Vallejo “Brothers and Sisters there is much to do”! The IMF has a list and is on the case. Sending more positive messages about world growth prospects would help. The time is right for the West to leave Planet Zirp and begin the rate rise. Central banks in the US and the UK should act now whilst some semblance of control over economic events persist. Moderate inflation is coming, rates must rise. Sure, the ramifications, for capital flows, exchange rates and asset prices will be significant across emerging markets. The so called “spill over effects” are within the natural rhythm of an effective world capital market. Growth may or may not be slowing in China. The oil price is acting negatively on growth in Russia, Brazil, Nigeria, Venezuela and the OPEC nations generally. The oil price movement is a zero sum game. There are winners and losers. Growth in India will be higher than that of China this year assisted by low energy prices. The developed world is benefiting. The changing dynamics of world growth should come as no surprise. But how long will low energy prices persist? Manufacturing - winners and losers since recession … Oil Price ... Oil Brent Crude closed above $50 this week. If prices hold at current levels, oil prices will be 11% higher year on year towards the end of 2015 and into January. The impact will quickly be reflected in manufacturing prices and consumer prices in the UK and across the world. Chinese imports of oil were up 10% year on year in the period to August according to the All China Market Research Company. The Number of US oil rigs has fallen to 600 from a prior peak of 1600 in October last year, as output tumbles. Conflicts in the Middle East, Russian bombs into Syria, Nato troops into Turkey. The potential for an oil price explosion is evident given geo political tensions, strong demand, a supply squeeze and a slight nudge from OPEC. Commodity prices are adjusting to over supply. The mists will slowly clear over the underlying Chinese growth rate this year and next. In farming it is said, the best cure for low prices, is low prices! And so it will prove into 2015. Energy and commodity prices will rally as strong growth continues across the world. So what happened in the UK this week … Trade Figures … The trade figures in August were disappointing but should come as no surprise to readers of The Saturday Economist. Month on month figures can be misleading and subject to revision. A trade in goods deficit of £125 billion is in prospect this year compared to a revised £123.7 billion last year. A service sector surplus of £95 billion will mitigate the problem. The overall trade in goods and services deficit just under 2% of GDP will not present a threat to growth at this stage. Manufacturing … The latest data from the Office for National Statistics continue to present a gloomy outlook for the manufacturing sector. Output in August fell by 0.8% following a drop of -1.2% in July. We expect manufacturing output in Q3 to fall by 1% compared to the same period last year. For the year as a whole, we now expect growth of just 0.5% in the current year compared to growth of 2.7% last year. Next year we forecast a slight improvement with growth up by 1.5%. That’s more or less in line with the long run [fifty year] average. The march of the makers will be unable to rebuild the workshop of the world any time soon and won’t hit the government £1 trillion export target by 2020. Overall manufacturing output remains some 7% below the pre recession peak and in line with levels experienced sixteen years ago, at the end of 1989. We expected too much from manufacturing in the re balancing agenda. The average rate of growth since 1950 has been just 1.5% hence the share of output decline in an economy growing at 2.5% plus. We analyse some fifty sectors in manufacturing. Strengths in food, beverages and transport equipment are high growth areas compared to the overall trend. Check out our manufacturing update for October to understand more about the vagaries of manufacturing in the UK. Available from the web site. So what of growth this year … We still expect the UK to grow by 2.8% this year and into next. Based on current data 2.6% is in prospect but we expect revisions at some stage to push the final out turn higher. Growth above trend in three consecutive years, rising wages, a tightening jobs market and rising energy inflation are inconsistent with base rates at 0.5%. A rate rise will come into focus towards the end of the year. So what happened to Sterling this week? Sterling moved up against the Dollar to $1.532 from $1.519 and moved down against the Euro to €1.347 from €1.351 The Euro moved up against the Dollar to €1.138 from 1.135. Oil Price Brent Crude closed at $52.94 from $48.00. The average price in October last year was $87.43. The deflationary push continues. A $75 - $80 recovery by Q4 remains the base case in our outlook forecast. Markets, up this week! The Dow closed at 17,045 from 16,348. The FTSE closed up at 6,416 from 6,129 Gilts - UK yields bounced. UK Ten year gilt yields were at 1.84 from 1.68. US Treasury yields moved up to 2.09 from 1.93. Gold moved up to $1,156 ($1,135). That's all for this week. Enjoy the rest of the week-end. John © 2015 The Saturday Economist by John Ashcroft and Company : Economics, Corporate Strategy and Social Media ... Experience worth sharing. The material is based upon information which we consider to be reliable but we do not represent that it is accurate or complete and it should not be relied upon as such. We accept no liability for errors, or omissions of opinion or fact. In particular, no reliance should be placed on the comments on trends in financial markets. The receipt of this email should not be construed as the giving of investment advice.  Gloomy data on manufacturing released by ONS … The latest data from the Office for National Statistics continue to present a gloomy outlook for the manufacturing sector. Output in August fell by 0.8% following a drop of -1.2% in July. We expect manufacturing output in Q3 to fall by 1% compared to the same period last year. For the year as a whole, we now expect growth of just 0.5% in the current year compared to growth of 2.7% last year. Next year we forecast a slight improvement with growth up by 1.5%. That’s more or less in line with the long run [fifty year] average. The march of the makers will be unable to rebuild the workshop of the world any time soon and won’t hit the government £1 trillion export target by 2020. So why is the performance of the manufacturing sector so dismal? In the UK, retail sales are booming with sales volumes up by almost 5% in the year to date. Car sales are soaring with registrations up 7% year on year. The housing market is experiencing strong growth with the volume of transactions up by 6% in August following growth of 15% last year. Consumer confidence is improving, earnings are increasing and the jobs market presents little threat to household prospects in the months ahead. Manufacturers should be benefitting from sales of construction and home products but are they? Internationally the picture is less attractive … Internationally the picture is less attractive. World trade limps along despite a recovery in the US and Europe. Prices are undermined by low energy and commodity prices. Margins are under pressure as the trade weighted value of sterling is up by 5% compared to last year. The “Sterling Effect” is much exaggerated. The pound was up by almost 7% in 2014 compared to prior year and manufacturers still managed growth of almost 3% in the year Sectoral Analysis holds the clue .. In our research we analyse over 50 sectors within the manufacturing sector. Not all sectors tell the same story. Some sectors continue in a process of long term decline, notably tobacco, textiles clothing, computers, electrical equipment, optical equipment and consumer durables. The housing market is bringing benefits to construction products including cement and plaster and also leading to a rally in furniture output to levels last experienced pre recession. Other sectors especially transport equipment are experiencing strong growth. Transport equipment output continues to expand in the areas of wheels, wings and water i.e. Marine, Motor and Aerospace activity. Capital goods have also enjoyed strong growth with a big recovery in engineering and allied industries. The food and beverages sector to experience steady and strong growth. Meat, fish and dairy products have experienced a strong rally since 2009. Output in the dairy sector has increased by 50% over the last six years. Bakery products are up by 25% from 2009 but have experienced a set back into 2015, possible victims of the Mary Berry home baking craze. Beverage sales are up especially the manufacture of alcohol products. Soaps, detergents, polish and perfumes remain as one of the great performers in the sector with steady growth through the recession The manufacture of wood, rubber, paints and paper products demonstrate a shock to output in 2008/9 with little recovery to date. In the chemical and petrochemical sectors, the shock to output is also evident with a limited recovery so far. The manufacture and processing of basic metals remains flat with a continued setback in casting and fabrications. The manufacture of weapons and ammunition remains some 40% below the pre recession high. Summary … Overall manufacturing output remains some 7% below the pre recession peak and in line with levels experienced at the end of 1989. We expected too much from manufacturing in the rebalancing agenda. The average rate of growth since 1950 has been just 1.5% hence the share of output decline in an economy growing at 2.5% plus. Hopes for a manufacturing rally were rhetoric without reason. The prospect of re shoring was illusory as the plans for Jaguar Land Rover to expand output overseas demonstrate. The UK does not have a revealed comparative advantage in manufacturing to stimulate export growth. The balance of payments trade in goods will continue to deteriorate despite some improvement this year from international energy, oil and commodity prices. The UK does have a varied manufacturing base, with real strengths in transport, food, drink and capital goods. The sector can only achieve so much in international trade and will offer so little to the rebalancing agenda. We should not expect too much from our manufacturers. JKA October 2015 For a copy of The Manufacturing Update October edition check out the download button on the home page. |
The Saturday EconomistAuthorJohn Ashcroft publishes the Saturday Economist. Join the mailing list for updates on the UK and World Economy. Archives
July 2024
Categories
All
|
| The Saturday Economist |
The material is based upon information which we consider to be reliable but we do not represent that it is accurate or complete and it should not be relied upon as such. We accept no liability for errors, or omissions of opinion or fact. In particular, no reliance should be placed on the comments on trends in financial markets. The presentation should not be construed as the giving of investment advice.
|
The Saturday Economist, weekly updates on the UK economy.
Sign Up Now! Stay Up To Date! | Privacy Policy | Terms and Conditions | |
 RSS Feed