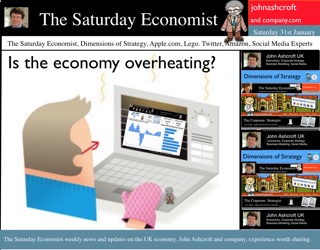
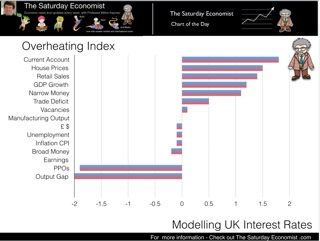
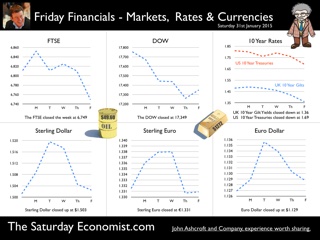
 A strange question to ask you may think! Inflation is set to dip into negative territory in the next couple of months. The Governor is set to write a letter to the Chancellor explaining why the MPC has failed to keep inflation near target and for many analysts the first estimate of GDP in Q4 suggests growth was slowing during the whole of 2014. As for monetary policy, base rates are at the zero bound, ten year gilts are at 1.4% and Andy Haldane suggests we met never see interest rates above 2.5% in our lifetime. So should we really worry about overheating? The preliminary estimate of GDP Q4 … The preliminary estimate of GDP in the fourth quarter of 2014 was released this week. GDP was 2.7% higher in the final quarter of 2014 compared with the same quarter of 2013. For the year as a whole, GDP growth was up 2.6% on prior year. In the quarter, the service sector continued to lead the recovery with growth up by 3.3%. Once again there was particularly strong growth in leisure, distribution and business services with growth averaging 4.3%, across the private service sectors (sector weighted basis). Manufacturing output … Manufacturing output increased by just 2% and construction growth increased by 3.5%. Energy, utilities and extractives continue to have an overall negative impact on the performance of the economy. So what of 2015? … The provisional ONS estimate is slightly below our expectations in the final quarter and for the year as a whole, for that matter. In 2015 we expect strong growth to continue, based in part on the performance of The Manchester Index™. Output in the economy, will be assisted by a slight improvement in the trade account deficit, as a result of the oil price bonus. We continue to forecast GDP growth of 2.9% in 2015, sustained by continued strength in the service sector, a modest slow down in construction and continued average growth around 2.5% in the manufacturing sector. So why worry about overheating? So why worry about overheating? The labour market is reaching levels of unemployment and rates last seen immediately prior to recession. Vacancy rates are at an all time high. Earnings are rising. Private sector pay is increasing by over 2%. As for inflation, service sector inflation remains over 2%. The effects of oil, energy and commodity prices will drop out of the system by the end of the year, providing the basis of a goods inflation price rebound. We expect oil prices to return to $75 plus. CPI inflation will be significantly higher towards the end of the year and into the first quarter of 2016. Service sector growth is above trend rate. Private service sector growth was 4.3% in the final quarter. Construction was up by 6% in 2014. The slow down in the construction final quarter a result of a repair and maintenance relapse, as new work especially housing continued to surge. House prices are still increasing by 6% in January. A slow down to 4% by the end of the year would represent normality, rather than market weakness. Consumer confidence is increasing with propensities to spend approaching 2005 levels. Retail sales are soaring, albeit with weaker prices. Retail sales volumes were up by 5% in the final quarter of 2014 with internet sales up by 8% in December. For monetarists, narrow money is growing at over 5% a year, broad money growth is flat. Sterling is soft against the dollar but strong against the Euro, caught, as it is, in the Euro Dollar transatlantic matrix. The internal deficit (Government borrowing) is still too high and the external deficit (Current Account) is at crisis levels last seen in 1974 and 1989. In the wider world, US growth was 2.4% in 2014 with growth forecasts of over 3% this year. Strong growth continues in China and India, Europe is recovering, the prospects for South America and Eastern Europe remain weak but the world recovery continues, with the IMF expecting growth of 3.5%. It is a strange world. According to Christine Lagarde : It is “A world of asynchronous normalisation of monetary policy and increasing volatility of capital flows.” Ah yes … In the UK the Financial Policy Committee places great emphasis on the importance of “counter cyclical buffers in the banking sector”. But in a world of asynchronous sector growth in the UK alone, it is difficult to know where we are in the economic cycle. Economic policy making doesn’t come with an accurate GPS device, it comes with a dodgy compass and a dated map, updated frequently and violently by the ONS. So what about UK rates? At the last MPC meeting, unanimity returned to the aviary. All doves now, no one is voting for a rate rise now, in view of the deflationary impact of energy prices. It isn’t so much that rates should rise now, it is beginning to look as if they should have been increased some time ago. We have spent too long on Planet ZIRP. Soon it will be time to leave … why? Because the UK economy is overheating, as always it simmers gently at first …. So what happened to Sterling this week? Sterling held against the Dollar at $1.503 and against the Euro at €1.331. The Euro closed against the Dollar at €1.129. Oil Price Brent Crude closed steady at London close at $49.60 from $49.15. The average price in January last year was $108.126. Markets, closed down. The Dow closed down at 17,349 from 17,754 and the FTSE closed down at 6,749 from 6,811. UK Ten year gilt yields moved down to 1.36 from 1.48. US Treasury yields fell to 1.69 from 1.81. Gold closed at $1,272 ($1,298). That’s all for this week. Check out our Oil Market Update. Don’t miss the Great Manchester Business Conference in March, the Social Media Conference in July and the Economics Conference coming to Manchester in October. It’s a great line up for all our events! John © 2015 The Saturday Economist by John Ashcroft and Company : Economics, Corporate Strategy and Social Media ... Experience worth sharing. The material is based upon information which we consider to be reliable but we do not represent that it is accurate or complete and it should not be relied upon as such. We accept no liability for errors, or omissions of opinion or fact. In particular, no reliance should be placed on the comments on trends in financial markets. The receipt of this email should not be construed as the giving of investment advice.
0 Comments
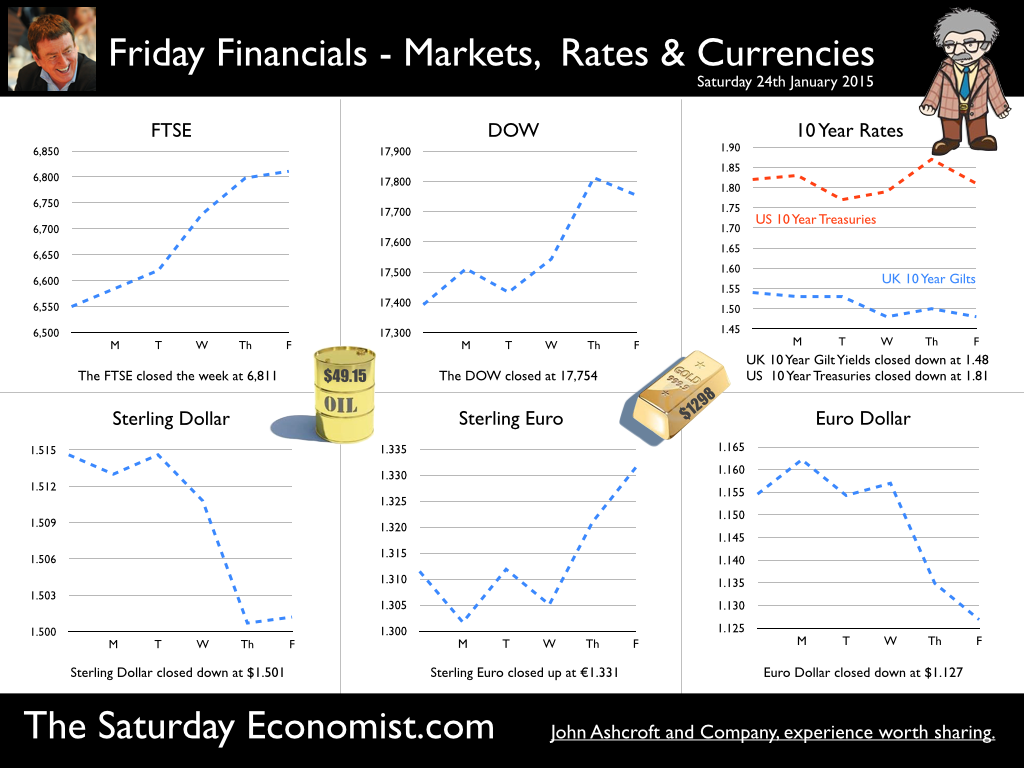
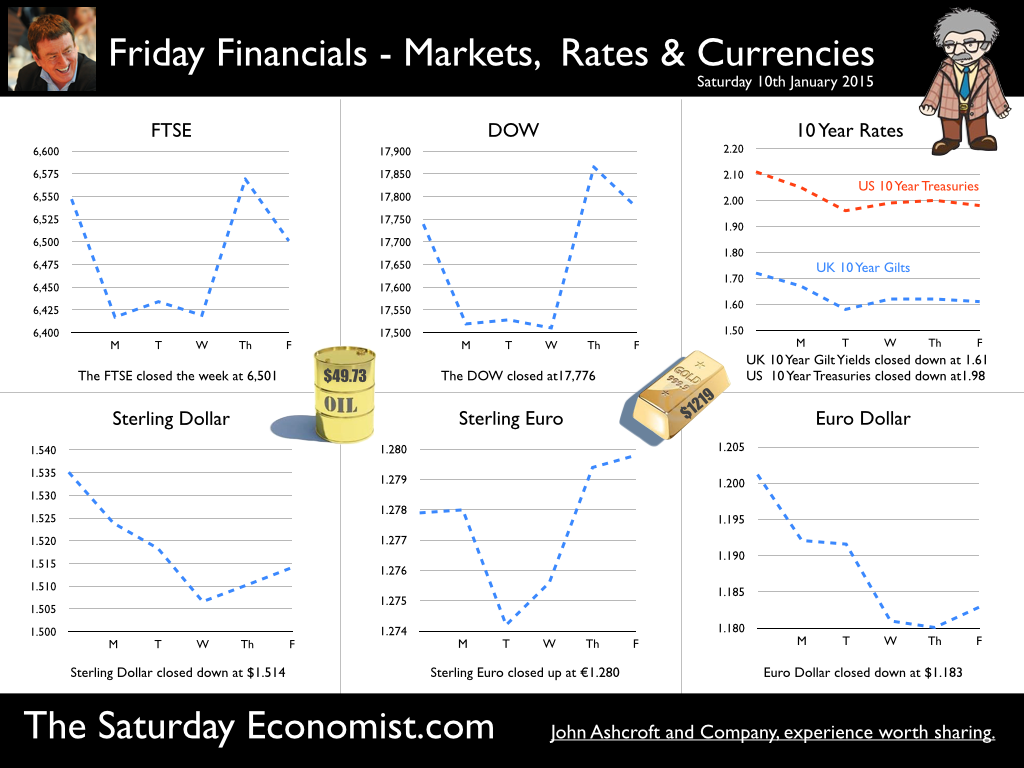
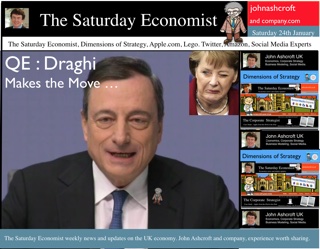 The Euro slumped to €1.127 against the Dollar this week. The Pound soared to £1.33 against the synthetic. Markets rallied, Bond yields fell. Now you can invest in Euroland bonds, with negative real yield and investment worth less on redemption than cost of acquisition. Welcome to the world of Planet ZIRP. Draghi has blown up the runway, ensuring no base rate take off is planned for at least two years ahead. Merkel kept mum, [sie sich auf die Zunge beißt] as Draghi announced the € trillion Euro plan to stimulate the stagnating economy. Mark Carney, governor of the Bank of England, called the ECB's action a "welcome step" and "absolutely necessary to preserve the prospects of medium-term prosperity in Europe". Markets loved the move, so long awaited. Volatility, volume and variance delivered across the world with juicy trader margins! What’s not to like. €60 billion of government bond purchases, each month from March 2015 until the end of September 2016. The move is planned to “strengthen demand, increase capacity utilization and support money and credit growth - thereby contributing to a return of inflation rates towards 2%.” OK, QE will lead to higher bond prices, lower yields and a weaker Euro. The latter in turn will increase inflationary pressure and may lead to a marginal increase in export volume. But what of domestic demand, especially amongst the Olive branch members? The jury is out. The evidence of QE success in the UK is not supported by spurious accuracy derived from dubious econometrics. For the moment, enjoy the move, a late ski holiday, avoiding Switzerland, the best option. So what happened in the UK this week? Golden Quarter ends on a high for retail sales … Retail sales increased by 4.3% in December compared to prior year. The surge in sales on Black Monday prior month, did not deprive retailers of a great end to the golden quarter. In the final three months of the year, volumes increased by 5.1% up by 3.9% for the year as whole. On line sales volumes increased by 8% accounting for just over 11% of all retail activity. Non food sales were up by 6.7% with particularly strong growth in household goods stores. We are forecasting total sales volumes of 3.5% in 2015, which may prove a little on the low side as real incomes improve through the year. With inflation set to average 0.8% in 2015, real income growth may well push volumes higher. Public Sector Finances December, some way to go if OBR targets are to be met … In December 2014, Public Sector Net Borrowing was £13.1 billion, an increase of £2.9 billion compared with December 2013. For the year to date, borrowing was £86.3 billion, a decrease of £0.1 billion compared with the same period in 2013/14. In December, central government expenditure included a £2.9 billion European Commission budget contribution. This expenditure increased the deficit, offsetting an overall modest improvement in underlying performance. Revenues in the year to date were up by 2.2% with a similar rise in expenditure up by 2.1%. VAT receipts were particularly disappointing in December, despite a 4% rise year to date. The interest bill will increase to over £50 billion in this financial year with a reduction in the gilt yield redemption from the Bank of England (year on year), exacerbating the problem. The Chancellor still has some way to go if the OBR targets for the year are to be met. The EC bill upset the recovery plan in December. Great hopes are placed on tax revenues due in the final quarter of the year. The best may have been left for the election run up! Continued improvement in Labour Market Data points to strong growth in Q4 … The UK labour market continued to improve, according to data released by the Office for National Statistics (ONS) today. The strength of the UK recovery continues into the final quarter of 2014. In December the claimant count fell to 868,000 and a rate of 2.6%. Over the year the claimant count number has fallen by 370,000. For the three months to November 2014, the wider LFS unemployment rate stood at 5.8%, sharply down from 7.1% over the same period 12 months ago. This is the lowest rate of unemployment since August 2008. Vacancies increased to 700,000, that’s higher than the levels achieved pre recession. The U:V ratio (Unemployment to Vacancies) fell to 1.24, approaching the levels last seen in the first quarter of 2008. Earnings increased averaging 1.8% in November. Construction and private sector earnings increased by 2.1%. With inflation falling to 0.5% in December, real incomes will receive a boost which will underpin the recovery into 2015. The data provides further evidence of the strong recovery in the UK into the final quarter of the year. We expect growth of almost 3%, to continue into 2015 and 2016. Unemployment rates are reaching levels last seen pre recession. The implications for skills shortages and rising pay rates are significant. The labour market is tightening, the capacity gap is evaporating. So what happened to Sterling this week? Sterling closed slightly down against the Dollar at $1.501 from $1.515 but moved up against the Euro to €1.331 from €1.311. The Euro closed down against the Dollar at €1.127 from 1.155. Oil Price Brent Crude closed steady at London close at $49.15 from $49.48. The average price in January last year was $108.126. Markets, moved up. The Dow closed at 17,754 from 17,392 and the FTSE closed up at 6,811 from 6,550. UK Ten year gilt yields moved down to 1.48 from 1.54. US Treasury yields fell to 1.81 from 1.82. Gold closed at $1,298 ($1,276). That’s all for this week. Check out our Oil Market Update to understand what's happening to prices. Don’t miss the Great Manchester Business Conference in March, The Social Media Conference in July and the Economics Conference coming to Manchester in October. It’s a great line up for all of the events! John © 2015 The Saturday Economist by John Ashcroft and Company : Economics, Corporate Strategy and Social Media ... Experience worth sharing. The material is based upon information which we consider to be reliable but we do not represent that it is accurate or complete and it should not be relied upon as such. We accept no liability for errors, or omissions of opinion or fact. In particular, no reliance should be placed on the comments on trends in financial markets. The receipt of this email should not be construed as the giving of investment advice. 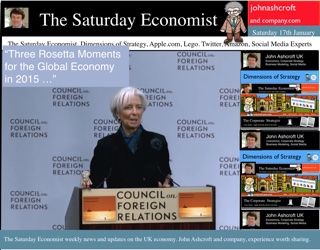 Christine Lagarde, speaking at the Council on Foreign Relations this week, suggests the drop in oil prices is a welcome shot in the arm for the global economy? Cheaper oil increases real consumer purchasing power [by real income and product substitution effects]. Private demand is boosted in oil-importing countries. “If oil prices will remain at low levels, oil could provide a positive contribution to global growth for some time to come”, says the head of the IMF. But is that really the case? In game theory a zero-sum game is a mathematical representation of a trade off in which a participant's gain (or loss) is exactly balanced by the losses (or gains) of the other participant(s). So it is with oil. The oil price fall is a zero sum game in which there are winners and losers. The net overall gain (or loss) to the world economy is neutral at best. The World Value of Oil … We estimate the world value of oil was worth some $3.6 trillion in 2013, based on an average price of $110 per barrel. Falling to $50 per barrel, the loss of income to the world economy and oil exporters specifically is almost $2 trillion. In 2013, oil market consumption equaled some 5% of GDP. Across the world at $50, the value falls to just below 2.5%. Net oil importers including the UK are beneficiaries. China, India, US and Japan benefit from the price falls. Oil exporters are the obvious losers. OPEC, Russia, Venezuela, Canada and Nigeria some of the obvious losers. For economies with internal or external deficits, the problem is particularly acute. Loss of revenues, capital flows and debt service capability, lead to currencies under pressure increasing volatility at a time of a dollar revanche. Fiscal deficits lead to reductions in state spending and pressure on domestic incomes. But even in advanced economies, net importers of oil will face deflationary effects. Lower prices lead to a loss of fiscal revenues. The overall impact on the world economy is at best a zero sum game. The overall impact may be more deflationary (rather than expansionary) than we would care to accept. Will prices stay low for long? The January STEO (short term economic outlook) from the authoritative EIA suggests oil prices will average $58 dollars in 2015 rising to $67 dollars in Q4 and averaging $71 dollars in 2016. If this is the case, the deflationary (price) impact on the UK, US and Europe will continue over the first half of the year with negative CPI rates appearing and persisting well into 2015. But will low prices persist? Adam Smith suggested “People of the same trade seldom meet together, even for merriment and diversion, but the conversation ends in a conspiracy against the public, or in some contrivance to raise prices.” It is time for the oil producers to have that conversation. The problem for oil is not demand. The world economy will grow by 3% this year and oil consumption along with it. The issue is supply and specifically the increase in US output. The increase over the last two years is not huge in world terms, it has a less than 2.5% significance for output expansion. The loss to the producers from the oil price fall is almost $2 trillion. The loss to OPEC is $600 billion. It would be cheaper to pay the US frackers to just stop fracking. Tipping over the honey pot to keep another bear out of the game is no solution for OPEC, nor for the world economy for that matter. The oil price collapse is a disproportionate response to the change in supply condition. So what of UK prices? Consumer prices CPI basis fell to 0.5% in December, driven lower by energy, petrol and food costs. The CPI 12-month rate was previously 0.5% in May 2000. Food prices fell by 1.9% and prices of motor fuels fell by 10.5%. Should we worry about UK deflation? Not really. Service sector inflation was 2.3% in the month. The slow down was marked in goods prices, falling by 1%. Economic theory and tabloid wisdom would have us believe deflation is a bad thing. Lower prices lead to a negative economic spiral. Households postpone purchases in anticipation of future price falls. Businesses suspend investment, job lay offs ensue. Unemployment leads to lower demand and off we go in a negative downward spiral. Significant price falls are in food and petrol. Hardly likely to lead to a delay in the purchase decision. Significant prices rises are still occurring in the service sector. Heavy smoking book worms, with kids at private school, the particular losers in the December inflation story. Tobacco prices increased by 8%, books and education increased by 10%. Lower prices will lead to a significant boost to real incomes in the short term. Lower prices will benefit the UK economy as we explained in our mid week post. Should we worry about deflation? Producer Prices … Output prices by UK manufacturers fell 0.8% in the year to December, compared with a fall of 0.6% in November. This was due to falling prices for crude oil, petroleum and food products. Input costs fell by almost 11%. With oil trading at $50 per barrel Brent Crude basis and with food and commodity prices still under pressure, the benign outlook for manufacturing costs is expected to continue over the first half of 2015 reducing the pressure on output and retail prices. So what happened to Sterling this week? Sterling closed unchanged against the Dollar at $1.515 but moved up against the Euro to 1.311. The Euro closed down against the Dollar at €1.155 from 1.83. Oil Price Brent Crude closed steady at London close at $49.48 from $49.73. The average price in January last year was $108.126. Markets, split. The Dow closed at 17,392 from 17,776 on weak retail sales reports but the FTSE closed up just, at 6,550 from 6,501. UK Ten year gilt yields moved to 1.54 from 1.61 before the break. US Treasury yields fell to 1.82 from 1.98. Gold closed at $1,276 ($1,219). That’s all for this week. Check out the Oil Market Update. Don’t miss the Great Manchester Business Conference in March and the Economics Conference coming to Manchester in October. It’s a great line up for both events! John © 2015 The Saturday Economist by John Ashcroft and Company : Economics, Corporate Strategy and Social Media ... Experience worth sharing. The material is based upon information which we consider to be reliable but we do not represent that it is accurate or complete and it should not be relied upon as such. We accept no liability for errors, or omissions of opinion or fact. In particular, no reliance should be placed on the comments on trends in financial markets. The receipt of this email should not be construed as the giving of investment advice.  Few can remember the 1930’s but many love to talk about. It is as if they were there, at the time, on the bread line, waiting for the soup kitchen to open. For many, falling prices recalls the history of the great depression. A period of falling prices - a result of demand deflation. A virtuous circle of twenties excess, morphed into a peccant process of impecunious imposition. Prices fall, demand collapses, the economy implodes. Will consumers postpone purchase decisions? Some believe, that when prices are falling, consumers will delay purchase decisions. Demand falls, business suffers. A collapse in sales means that investment decisions are postponed. The fall in demand leads to business layoffs. Business layoffs, lead to higher unemployment. Higher unemployment leads to lower incomes. Lower incomes lead to a fall in effective demand and before we know it, we are back on the bread line, scrabbling for crumbs. Keynes spoke of the Liquidity Trap. Alvin Hansen developed the term “secular stagnation”. describing what he feared was the fate of the American economy following the Great Depression of the early 1930s. A lack of technical innovation to stimulate growth and demand in a slowing economy would lead to a permanent stasis of low and declining economic activity, he said. Larry Summers, supported by Paul Krugman and others resurrected the theory in 2014, suggesting advanced economies might be suffering from “secular stagnation” post the 2008 crash. A lack of demand, would lead to low growth, low growth would lead to secular stagnation and we would enter into the Keynesian liquidity trap. Strange - as this year, growth in the USA returns to trend and the world economy is set to grow by over 3% this year. Hansen’s forebodings were proved to be quite wrong in 1938. Those fearing secular stagnation, lower prices and a bout of deflation will be equally derived of the downside in 2015. Cost push or demand pull? Before monetarism became fashionable, we were taught to distinguish between inflation as a function of cost push or demand pull. Conversely, deflation is a function of cost push down or the lack of effective demand. Retail prices in the current round are affected by lower oil and energy costs together with lower commodity and food prices. Good deflation results from lower costs - oil, energy, transport, utilities, food and commodities. Bad deflation results from a lack of domestic demand and an immediate threat to output. The lack of domestic demand in Euroland is rather more complex and concerning but the lack of effective demand is less of an issue in the rest of the world. For monetarists, those who would believe that inflation is always and everywhere a monetary phenomenon have been particularly disappointed by the lack of inflation post QE and life on Planet ZIRP with interest rates set at the zero bound. At present, inflation is always and everywhere an international phenomenon, determined by the relatively low growth of world trade and a commodity cycle, including oil, in an over supply phase. Will consumers postpone purchases if prices are falling? Will consumers postpone purchases if prices are falling? Not really. Analysis of household spending in the UK confirms almost 80% of spending is non discretionary. Spending on housing, fuel, utilities, transport, food, drink, alcohol, drugs, tobacco, clothing, footwear, education, communications and health are unlikely to be affected by falling prices. The so called elasticity of inter temporal substitution as a function of negative prices is extremely low in many sectors. In household goods, electricals, mobile phones and computing for example, hedonic price adjustments have meant prices have been falling in real times for decades. Clothing and footwear prices are15% lower than 2000. White goods and electrical down 50% over the last decade. Highly discretionary non essential luxury goods, may lead to a price postponement. But if I thought my new Bentley would cost 2% less next year would I really wait? Car sales have been booming in 2014 in the UK but easy finance and payment plans have meant no significant capital outlay is required. Immediate gratification is a higher motivation to expenditure the variations in the savings ratio and the life cycle hypothesis. The frog in the saucepan, the explorer in the stew pot ... When we talk of the dangers of low inflation, we worry of low inflation, slowly rising, out of control, leading to hyper inflation. Low inflation is like the frog in the saucepan or the explorer in the cannibal’s stew pot. Happy at first as the temperature slowly rises, discomforted significantly, as boiling point nears. Rising inflation, raises fears of vast quantities of devalued currency, moving around in wheelbarrows, as with the period of hyperinflation in the Weimar republic. Lower prices and a bout of deflation are not a threat to consumer spending in the short term. Quite the opposite, as the kick to real income growth takes effect, spending may increase. But left untended deflation is a problem. The frog in the saucepan hops out into the cold. Cold turns to light frost. Light frost to freezing, somnolence and hypothermia ensues. Hibernation or death is the option. Lower prices in housing for example would be a major problem. If houses will be cheaper in a years time and even ten years time. Who would want to borrow against a depreciating asset? The housing market would suffer. The buy to let market would be a modest beneficiary but the damage to the construction sector would be intense. So a short, small bout of deflation may not be a bad thing. But a prolonged period of falling prices would mean the frog is out of the saucepan, falling asleep along the side of the road. We should welcome but be wary of negative inflation rates.  The year has certainly got off to fascinating start. The collapse in oil prices, deflation in Europe, the Routing of the Rouble, the Drama of the Drachma and the ever present threat of a Chinese implosion. Over the break, we have been struggling to get to grips with the collapse in oil prices and the late revisions to the UK GDP data - but we are getting there! GDP Revisions … Two days before Christmas, all forecasts were set, a 3% growth - a pretty safe bet but in the final revision to GDP data in 2014, the ONS revised down the estimate for growth in Q3 from 3% to just 2.6%. We now think growth for the year as a whole will be 2.8%, down on our (and the OBR) earlier estimates of 3% and way below the Bank estimates of 3.5% growth in 2014. Next year we expect the growth to continue at a similar rate. As always we caution we are not forecasting the output of the British Economy, more the output of the Office for National Statistics. Our Quarterly Economics Update with full forecasts for 2015 will be released next week. Oil Prices … Oil prices have collapsed to $50 per barrel Brent Crude basis compared to $110 per barrel earlier in the year. A slow down in China and the surge in US shale is the tabloid claim to blame but our Oil Market Update for 2015 released this week is a more comprehensive assessment of the real problems facing oil prices. What is pushing oil prices lower? Will prices stay low? What are the prospects for oil demand growth? Which countries are the winners and losers? What is the impact of lower oil prices on the economy? Are lower oil prices good for growth? What does the falling price mean for the consumer? We measure how US rigs go up as oil prices rise. The real challenge - Sheiks versus Shale and the return of the speculative bubble map, as we outlined just before Christmas. The update is comprehensive and is a FREE download ! Manufacturing, Construction and Trade … So we return to the latest economic data releases this week … Manufacturing Output rallies in November … Manufacturing output increased by 2.7% year on year in November compared to an increase of just 1.7% in the prior month. We now expect manufacturing growth to increase by 2.4% in the final quarter of the year and by 2.6% for the year as a whole. Once again, consumer durable output was particularly strong up by 6.8% (a reflection of a strong housing market). Capital goods also demonstrated strong growth up by 3.3%. Textiles and clothing continue to pull down the overall performance falling by 9.3%. Manufacturing output remains some 6% down from the peak levels of 2008. We expect manufacturing growth to continue into 2015 at a rate of 2.5% for the year as a whole. The UK recovery continues but with a continued dependence on service sector growth. Construction Output - Housing drives recovery in November … Construction output increased by 3.2% year on year in November. A strong growth in new work (up 5.6%) was offset by a subdued repair and maintenance performance falling by just under 1%. Is this a problem for growth? Not really. Housing construction increased by 23% over last year as the strong rally in the housing market continues. We forecast construction growth of just over 3% in the quarter and remain confident of strong growth of almost 4% into 2015. Trade Performance November … The UK’s deficit on trade in goods and services was estimated to have been £1.4 billion in November 2014, compared with £2.2 billion in October. A deficit of £8.8 billion on goods, partly offset by an estimated surplus of £7.4 billion on services. The narrowing of the deficit reflects a fall in imports of goods rather than an increase in exports. Most of the reduction is explained by a £0.7 billion decrease in imports of oil. In the Saturday Economist, Oil Market update, we estimate a 10% fall in the oil price will lead to a £1 billion improvement in the UK balance of payments over the year. In November the oil price Brent crude basis was down by 25%. In December, the price difference increased to over 60%! The improvement in the trade account is set to improve in the short term as a result of the oil price fall but we still expect the overall trade in goods deficit to be around £120 billion this year. As for the future, $50 dollar oil could lead to a £5 billion bonus to the trade account. However, we caution, low oil prices are just for Christmas … not for life. We expect oil prices to bounce back this year. Elsewhere in the World … USA The US economy created 252,000 jobs in December broadly in line with consensus expectations. The unemployment rate stood at 5.6% in December, compared to 5.8% prior month. US employment gains for the year as a whole remain strong. For the moment, earnings and wage growth remains weak, assuaging fears of an early Fed rate hike. Elsewhere in the World … Europe The Eurozone slipped into deflation for the first time since October 2009 as the annual change in the Consumer Price Index fell to -0.2% in December according to Eurostat data. The unemployment rate across the currency area remained steady at 11.5%. Greece and Spain have already been in deflation for some months with unemployment rates more than twice as high as the Eurozone average. In Germany unemployment has been falling (now at 6.5%) with inflation just positive at 0.2%. The pressure on the ECB to exercise some form of QE remains intense, pushing the Euro lower. So what happened to sterling this week? Sterling closed down against the Dollar at $1.5140 but moved up against the Euro to 1.280. The Euro closed down against the Dollar at €1.183. Oil Price Brent Crude closed down at $49.73. The average price in January last year was $108.126. Markets, were disturbed. The Dow closed at 17,776 and the FTSE closed at 6,501. So much for 7,000 in the Christmas stocking! Or even New Year? Or even 2015? UK Ten year gilt yields moved to 1.61 from 1.88 before the break. US Treasury yields fell to 1.98. Gold closed at $1,219. That’s all for this week don't miss The Oil Market Update and don’t miss the Economics Conference coming to Manchester in October. It’s a great line up! John © 2014 The Saturday Economist by John Ashcroft and Company : Economics, Corporate Strategy and Social Media ... Experience worth sharing. The material is based upon information which we consider to be reliable but we do not represent that it is accurate or complete and it should not be relied upon as such. We accept no liability for errors, or omissions of opinion or fact. In particular, no reliance should be placed on the comments on trends in financial markets. The receipt of this email should not be construed as the giving of investment advice. |
The Saturday EconomistAuthorJohn Ashcroft publishes the Saturday Economist. Join the mailing list for updates on the UK and World Economy. Archives
July 2024
Categories
All
|
| The Saturday Economist |
The material is based upon information which we consider to be reliable but we do not represent that it is accurate or complete and it should not be relied upon as such. We accept no liability for errors, or omissions of opinion or fact. In particular, no reliance should be placed on the comments on trends in financial markets. The presentation should not be construed as the giving of investment advice.
|
The Saturday Economist, weekly updates on the UK economy.
Sign Up Now! Stay Up To Date! | Privacy Policy | Terms and Conditions | |
 RSS Feed