 Good news for the Chancellor this week! Borrowing for the financial year 2014/15 came in at £87.3 billion, down by £11.1 billion on prior year and below the OBR latest estimate. The government is on track to hit the OBR target of £75 billion and below next year. It all came good just in time for the election. Somehow we always thought it would! At the end of March 2015, public sector debt was £1,484.3 billion (81% of GDP), an increase of £82.2 billion compared with March 2014. Government borrowing is 4.8% of GDP and set to fall much further next year and beyond. The Government may well be able to slash borrowing and begin to pay down debt from 2018 onwards. But will it? What happens next, will largely be determined by the outcome of the election. Just a few weeks now and we will be better able to pattern the level of borrowing and debt in the years ahead …! Retail Sales Boom Continues … In other news, retail sales in March increased by 4.2% year on year and by just over 5% in the first quarter of the year. Sales values on the other hand increased by less than 1%. The fall in petrol prices (down 15%) is biasing the overall figures. Retail sales are booming. Department store and non food store sales were up by almost 7% and 5% respectively. Household good stores sales were up by over 11%, with the average spend increasing by over 7%. Food sales increased by 3.5% with values up by less than 1%. Retailers hate the scenario of more volume and work with diminished margin. It remains tough for the big four. Online sales increased by over 10% year on year, accounting for almost 12% of all sales activity. Omni channel with mobile connectivity, the new mantra in the high street and beyond … Car Production … This week, the Society of Motor Manufacturers and Traders released the latest data on UK car manufacturing. Production increased by 2% in March with 144,893 cars built – the best March since 2006. Productivity is increasing ... In fact productivity in car manufacturing is at an all-time high. Over the past five years, 11.5 vehicles were produced a year for each person employed in the industry. For the period from 2005 to 2009, the figure was just 9.3 vehicles produced per employee per year. So how does the relate to the ongoing drama about the lack of productivity in the UK? The answer is pretty simple. Last week we published our Analysis of Productivity Trends in the UK, using data for thirty sectors over the past fifty years. Transport has the highest rate of productivity across all sectors ... The SMMT data confirms this trend. But growth in transport output, is below the overall level of output in the economy. Stronger growth in private sector services, is determining the apparent decline or lack of growth in UK productivity. In the service sector, productivity growth is half that of manufacturing and in certain sectors it is near unity. So much of the job growth has been in sectors with low rates of productivity growth. In the service sector, we should think of productivity as an output of growth and not a driver of growth. When restaurants, hotels, pubs, distribution centres, delivery services and retail are busy, productivity rises. Conversely when they are not, output per capita falls as does apparent productivity. As the economy continues to recover and the level of activity increases, something will turn up. It will be UK productivity. And what of the international comparison … It is suggested that UK productivity is some 20% below the levels of Germany, Italy and Italy! What nonsense this is! It is to compare Äpfel und Orangen, Pommes et Oranges, Mele e Arance. Manufacturing in Germany is over 20% of GDP, just over 15% in Italy and about 10% in France. We would expect a higher rate of productivity in both German and Italy as a result. But the big question is “What exchange rate did they use”? If Sterling is weak against the Euro, productivity in Europe will appear to be higher. If the Euro is weak against Sterling, productivity in Europe will appear to be lower. So what exchange rate did they use? The ONS used the OECD Purchasing Power Parity Values last updated in 2013. They could have used The Economist Big Mac Index, it could have done the job just as well! Had the average Euro values between 2005 and 2008 been used (€1.45), Italian productivity would appear to be lower than the UK. German productivity measured as GDP per worker would be 9% below that of their UK counterparts! Ah yes the slothful indolence of the average German worker, toiling in the miracle Mittelsand for so little effect. Was is los? We ask with a smile. International comparisons of productivity offer spurious accuracy which should be used with extreme caution, especially in Manchester. Wir sind nicht Berliners! So what of rates? Markets still believe the Fed will begin to increase rates in Q3 this year. Once the Fed makes a move, the MPC will surely follow. We could be leaving Planet ZIRP before Christmas …. Buckle up! So what happened to Sterling this week? Sterling moved up against the Dollar to $1.514 from $1.4595 and moved up against the Euro to €1.397 from €1.386. The Euro rallied against the Dollar at €1.083 from €1.078. Oil Price Brent Crude closed at $64.94 from $63.89. The average price in April last year was $107.76. The deflationary push continues. Our forecasts of a $75 - $80 recovery, no longer so far fetched. Markets, moved back above the magic marks. The Dow closed at 18,055 from 17,851and the FTSE closed above 7,000 at 7,071 from 6,993. UK Ten year gilt yields moved up to 1.69 from 1.60. US Treasury yields moved up, to 1.96 from 1.91. Gold slipped to $1,180 ($1,204). That’s all for this week. Don’t miss The Big Social Media Conference in July and The Great Manchester Economics Conference in October. It’s a great line up for all events! The Saturday Economist - now mailing to 50,000 businesses every month! John © 2015 The Saturday Economist by John Ashcroft and Company : Economics, Corporate Strategy and Social Media ... Experience worth sharing. The material is based upon information which we consider to be reliable but we do not represent that it is accurate or complete and it should not be relied upon as such. We accept no liability for errors, or omissions of opinion or fact. In particular, no reliance should be placed on the comments on trends in financial markets. The receipt of this email should not be construed as the giving of investment advice. 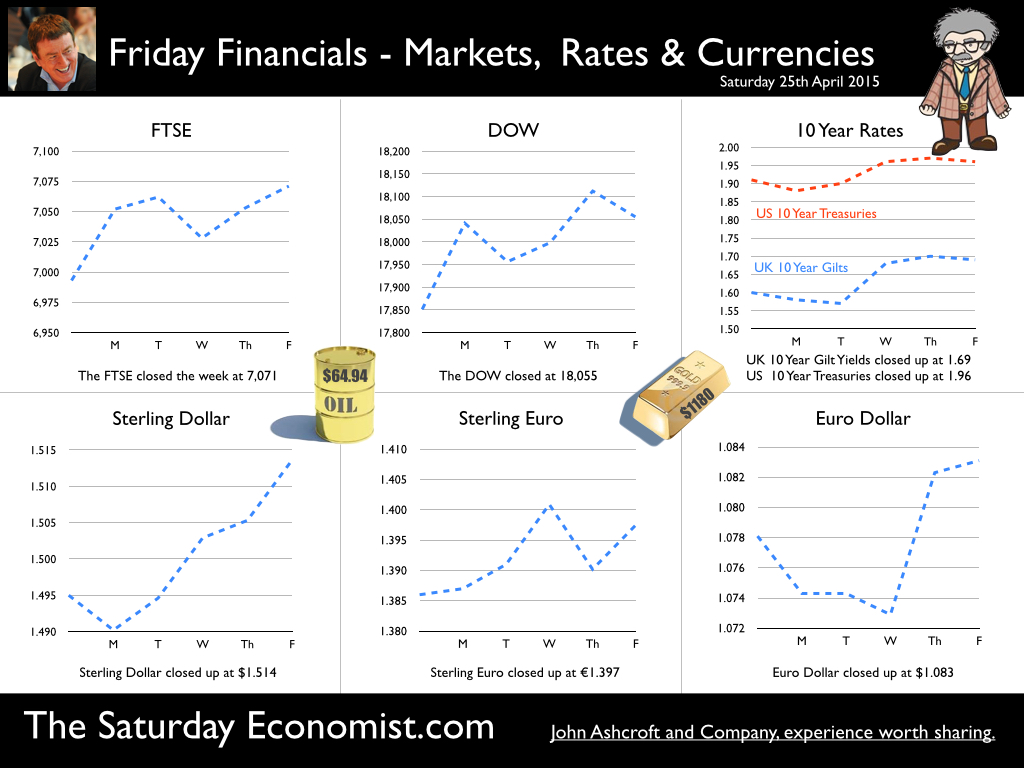
0 Comments
Leave a Reply. |
The Saturday EconomistAuthorJohn Ashcroft publishes the Saturday Economist. Join the mailing list for updates on the UK and World Economy. Archives
July 2024
Categories
All
|
| The Saturday Economist |
 RSS Feed
The material is based upon information which we consider to be reliable but we do not represent that it is accurate or complete and it should not be relied upon as such. We accept no liability for errors, or omissions of opinion or fact. In particular, no reliance should be placed on the comments on trends in financial markets. The presentation should not be construed as the giving of investment advice.
|
The Saturday Economist, weekly updates on the UK economy.
Sign Up Now! Stay Up To Date! | Privacy Policy | Terms and Conditions | |