 The Labour Market is Cooling ... "No Gangbusters Growth" ...
Mixed news for policy makers in the labour market data this week. The economy is slowing down, not "going gangbusters" after all. Unemployment is increasing, the number of vacancies is falling. Unemployment increased to 1,486 million at the end of March compared to 1,320 million at the end of December. The jump of 166,000 over the period was matched by an increase in the unemployment rate from 3.8% in December to 4.3% by the end of March. The number of vacancies in the economy fell to 898,000 in the three months to April compared to 929,000 in December. Not a huge drop, a reversion to trend perhaps, marked by significant recruitment difficulties in health, social care, accommodation, food, retail, distribution and professional services. Our standard models suggest, for an unemployment count of 1.5 million, the level of vacancies should be around 820,000. The variance (near 80,000) a measure of recruitment difficulties in the economy, adding pressure to wage rates and earnings. Average earnings (total pay including bonuses) averaged 5.7% in the three months to March. This down from a peak of 9.3% single month in July last year. Markets are braced for the April data which will include the near 10% hike in the minimum wage. Of itself not a huge kicker but watch out for the "compression effect" as lower paid workers seek to maintain differentials in the coming wage rounds. Huw Pill Strikes Dovish Tone ... The Bank of England's top economist has boosted hopes of lower borrowing costs after saying it is "not unreasonable" to expect the Bank to consider cutting interest rates over the summer. Huw Pill, the Bank's chief economist, told an online event organised by ICAEW, the Bank could consider cutting rates if inflation continues to ease off. Pill has been actively discussing the potential for interest rate cuts during the summer in various media outlets this week. His comments have sparked considerable interest among investors, markets and commentators. He acknowledged the recent indicators showing a slight increase in unemployment and a deceleration in wage growth, which could suggest a slowdown in regular pay growth in the months to come. Despite these signs of easing, he emphasised the British labour market remains tight by historical standards. This context is crucial. It influences the BoE's decisions on monetary policy, particularly interest rates. During his presentation to the Institute of Chartered Accountants in England and Wales (ICAEW), Pill mentioned that it was a reasonable assumption for the BoE to consider rate reductions during the summer months. However, Pill also cautioned against cutting rates too soon, warning that inflation could become "embedded" if the Bank tolerates high wage growth and service sector prices rises. "The direction of inflation is moving correctly, the BoE must remain vigilant to ensure that inflationary pressures do not become entrenched." "The Labour Market Is Rebalancing", says Greene The labour market is rebalancing and inflation is on a "benign"" path, Megan Greene has said this week, boosting hopes that interest rates could come down next month. Megan Greene, an external member of the Bank's rate setting monetary policy committee, said the supply of and demand for workers was better aligned, having been out of balance for the past two years. She said that this would constrain pay growth and would suppress inflation. Markets now expect a first rate cut in June with two further rate cuts possible before the end of the year. Strong growth figures in the U.S. in the first quarter, imply there will be no Fed rate cut in the Summer months. The Governor has explained, "There is no law which says the Fed must move first and everyone else moves afterwards". It's just usually like that!. And so it may be after all ... In the U.K., June may just be a bit too soon ...
0 Comments
 U.S Rate Cuts Could Come In September ... Traders appear increasingly confident, the U.S. Federal Reserve could start cutting interest rates as early as September, as inflation data cooled more than expected in April. Jerome Schneider, head of short-term portfolio management at PIMCO, said on Thursday, the latest U.S. inflation data confirmed to investors the potential for a near-term rate hike was now off the table. The next move will be down. John Authers, Points of Return, Bloomberg this week explained the market dilemma. "There was white smoke over the Bureau of Labor Statistics on Wednesday morning. The key measures of consumer price inflation for April confirmed expectations for a slight decline, and alleviated growing anxiety over a possible re acceleration. [Inflation CPI basis eased to 3.4% in April from 3.5% prior month.] The numbers could easily have been worse, and after a month in which prices had discounted growing risks of inflation, the direction of travel on markets made total sense. Bond yields should come down a little in these circumstances, while equities are reinforced. It is, however, reasonable to question whether these numbers were any kind of a turning point in the battle against inflation. To start, this "beautiful" chart generated by Bloomberg Economic Analysis breaks CPI into four major components; food, fuel, other goods, and other services. Two years ago there were major shocks to the prices of goods, food and energy, all of which have now dissipated. That's why inflation is much lower now. The problem is that services inflation remains stubbornly high, and accounts for substantially all of headline inflation at this point." 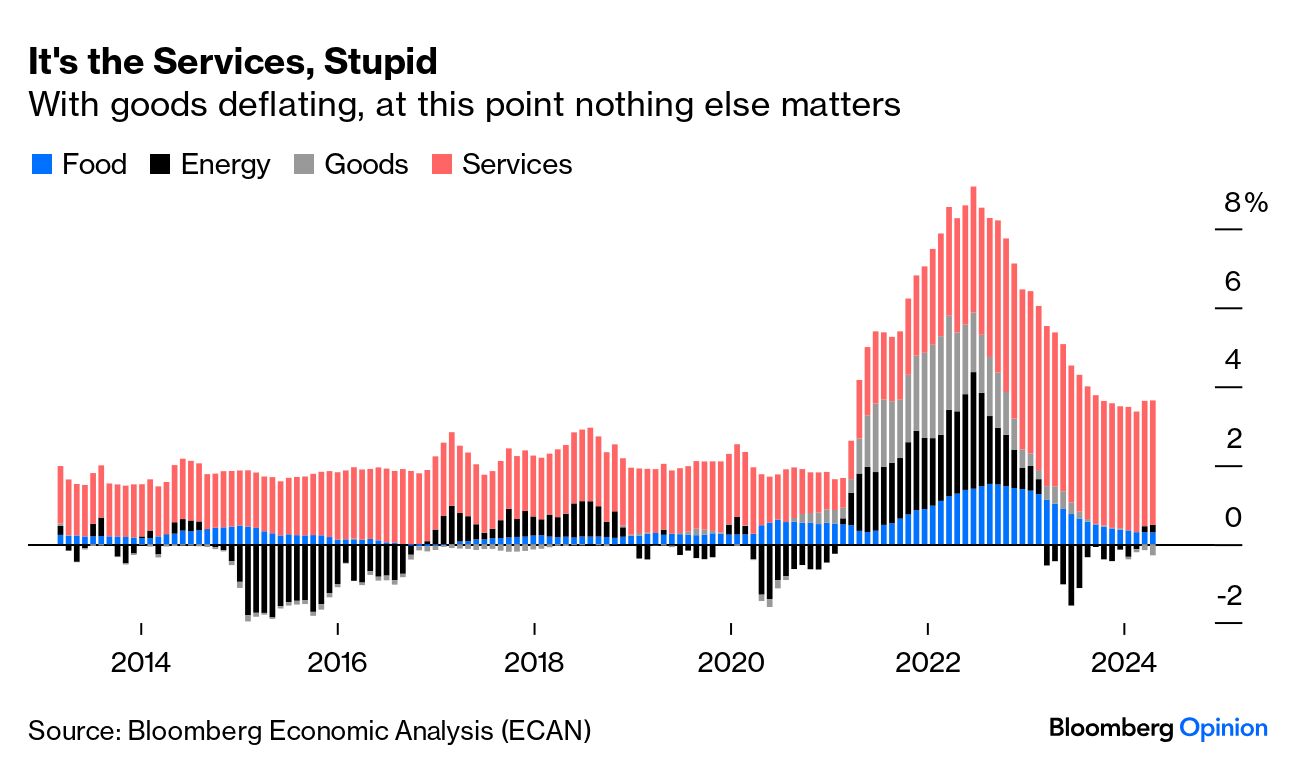 "The Atlanta Fed's sticky price index, concentrates on goods and services whose prices take a while to change and seldom fall. This is inflation that's particularly difficult to reverse, and so any rise will make the central bank uncomfortable. It is coming down, but very slowly, and it remains above 4% level. Taken together these confirm that disinflation is still happening while there is no sign of an outright acceleration. So rate hikes look very unlikely. But cuts in the near term can also be ruled out as several key measures are sticky and remain too high." Markets expect the first U.S. rate cut in September, with two possible rate cuts before the end of the year. It remains to be seen if the Bank of England will move ahead of the Fed ... 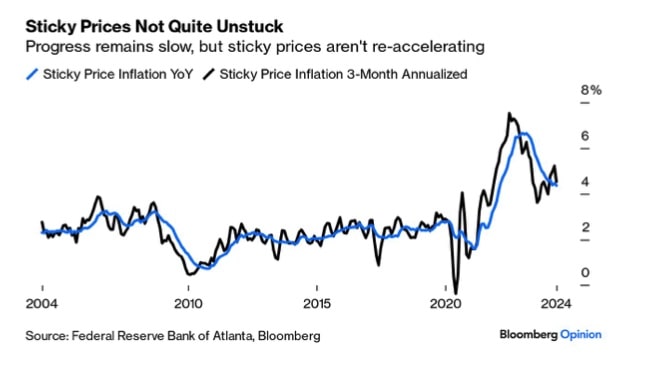  Britain's economy is going "Gangbusters" the UK's statistics office has said. Britain has escaped recession. The Office for National Statistics (ONS) hailed the performance of the economy. Gross domestic product (GDP) expanded by 0.6pc in the first quarter of 2024. (Quarter on Quarter).
ONS chief economist Grant Fitzner said: "To paraphrase the former Australian Prime Minister Paul Keating, you could say the economy is going gangbusters." Chancellor Jeremy Hunt said: "Today's growth figures are proof that the economy is returning to full health for the first time since the pandemic." Really? There is a strange statement in the Bank of England's Agent survey of business conditions which should serve as a warning. "Subdued consumer demand is widespread across the retail and service sectors. While some of the weakness in spending in 2024 Q1 was owed to poor weather, there is also a sense that underlying demand has weakened, although contacts are unsure as to the reason." Demand has weakened, subdued demand is widespread and businesses are not quite sure why! Hardly an economy that is "going gangbusters". More like an economy subject to political "Gaslighting" as Rachel Reeves suggests. Dig into the detail of the GDP figures for the first quarter, growth year on year was up by just 0.2%. Service sector growth was up by 0.3% boosted by public sector growth of over 2% in defence, social security, education, health and social work. In private sector services, output fell by -0.4% with significant drops in accommodation, food, transport, storage, finance and insurance. The leisure sector continues to suffer for the fourth quarter in succession. Retail trade sectors have been in negative territory for seven quarters with a slight uptick in Q1. The construction sector contracted for the second consecutive quarter by -0.6%. (Manufacturing the hero sector up 2.1% in the first quarter). Jeremy Hunt, the chancellor, told Times Radio that the figures were “more positive than many people have perhaps been thinking”. Rishi Sunak said the economy had “turned a corner”. Demand has weakened, subdued demand is widespread and businesses are not quite sure why! Hardly an economy that is "going gangbusters". More like an economy subject to political "Gaslighting as Rachel Reeves suggests. "Gangbusters by Gaslight" our theme for the week.  The Doves Take Flight ...
At the MPC meeting this month, the committee voted to maintain bank rate at 5.25%. Two members of the MPC, Dave Ramsden and Swati Dhandri voted against the proposition. Two doves take flight, preferring to reduce Bank Rate by 25 basis points to 5%. The Bank of England's decision to hold the base rate for a sixth consecutive meeting came as little surprise. Inflation is due to fall below the target rate of 2.0% when data for April comes out later this month, largely impacted by the Ofgem rate cap. The Bank expects inflation to rise back above target in the coming months ending the year at around 2.5%. Service sector inflation remains and high rates of wage growth will impede the path to lower inflation, it is said. Nevertheless the Governor Andrew Bailey was remarkably dovish. "It is likely we will need to cut rates in coming quarters, more than implied in the current market forecasts." he said. The possibility of a rate cut in June returns. "June rate changes are neither ruled out nor a fait accompli", teased the Governor. Don't you just love it when central bankers talk French. Strong growth figures in the U.S. in the first quarter, imply there will be no Fed rate cut in the Summer months. But the Governor explained, "There is no law which says the Fed must move first and everyone else moves afterwards". [It's just usually like that!]. GDP growth is expected to pick up, slack is likely to increase, excess supply is likely to appear, second round effects on wages and prices are expected to ease as real incomes grow to offset wage round pressures. All this suggests a path to lower rates but the Governor cautions ... "Inflation must come back to target on a sustainable basis". Then the usual boiler plate. ... "The MPC remains prepared to adjust monetary policy as warranted by economic data to return inflation to the 2% target sustainably. It will therefore continue to monitor closely indications of persistent inflationary pressures and resilience in the economy as a whole, including a range of measures of the underlying tightness of labour market conditions, wage growth and services price inflation." "The Committee will consider forthcoming data releases and how these inform the assessment that the risks from inflation persistence are receding. On that basis, the Committee will keep under review for how long Bank Rate should be maintained at its current level." Economists at Swiss bank UBS were among those who shifted their view on when the BOE may lower interest rates, saying they were now expecting the first rate cut to take place in June rather than August. "The broader message and the tone of the MPC were more dovish than we had anticipated," economists said, in a note published after the BOE's latest interest rate decision. UBS cited changes to the BOE's forward guidance, inflation expectations and comments from Bailey regarding the impact of increased national living wages on overall wage growth as reasons for its changed expectations. The Swiss bank now expects rates to be cut in June, August and November, by 25 basis points each. Our Friday Forward guidance remains. We expect the first cut could be as early as June, with two further rate cuts possible by the end of the year. This is the dovish scenario but watch the data!  Trump could set interest rates if elected ...
If elected President, some Trump advisers argue the president should be consulted on interest-rate decisions. Former President Donald Trump's political operatives are putting together a plan that would give him unprecedented influence over the Federal Reserve, including a provision that could make him an "acting" central bank board member, according to a report from The Wall Street Journal. It's a great idea. Announcements of changes to Fed rates would probably be announced to paying subscribers on Truth Social first, boosting subscriptions. Insiders will also benefit from membership of an exclusive hedge fund group in a new division of the Trump Media and Technology Group. Could that happen? Not really, or could it? The Dream of Fed Rate Cuts Is Slipping Away ... It's bad enough in the US at present. The Dream of Fed Rate Cuts Is Slipping Away, according to the Wall Street Journal. Investors are backing away from expectations the central bank will reduce rates in coming months. The next move could well up. 3 month Treasuries have risen to 5.5%. Twelve month Treasuries trade at 5.25%. Ten year bond yields have jumped 50 basis points to close at 4.7% this week. Traders are now betting on a rate hike. This shift comes after unexpectedly strong US economic data, combined with hawkish mutterings on the part of Fed officials. Options markets suggest there is a one-in-five chance of a rate rise within 12 months. What's the problem ... Markets are spooked by the rise in US inflation in March CPI basis to 3.5%. Core inflation excluding food and energy increased to 3.8% over the year. CPI inflation peaked at 9.1% in June 2022 in this cycle. It then fell to 3.0% in June 2023. It is now on the rise again. Bad. Growth is exceeding expectations. GDP growth accelerated to 3.0% in the first quarter of 2024 compared to 2.5% in 2023. Markets were slightly misled by the statement from the Bureau of Economic Analysis (BEA) which suggested real gross domestic product (GDP) increased at an annual rate of 1.6 percent in the first quarter of 2024. This is based on a quarter on quarter comparison. We always use the year on year data which confirmed growth of 3.0% year on year. That's the one to watch! Our current Friday Forward Guidance is or was, "We continue to model U.S. base rates peaking at 5.25% in 2023 moving to 4.50% in late 2024. We expect the first cut in June." This seems unduly optimistic. The latest thinking from the Federal Reserve, as of April 2024, indicates a cautious approach towards cutting interest rates. Persistent high inflation could delay any reductions until later in the year. Federal Reserve Chair Jerome Powell (time limited if Trump is elected) has expressed recent data have not provided greater confidence that inflation is fully under control. Instead, the data suggest inflation may remain elevated for longer than previously expected. This could extend the period of higher interest rates. Powell's comments imply the Federal Reserve might not proceed with the three quarter-point rate cuts this year that officials had projected during their March meeting. The Fed chair has indicated that if inflation persists at high levels, the Fed could maintain its current interest rate stance for an extended period. So what to expect now? We model U.S. base rates peaking at 5.25% with no further rate hike probable this year. We would now expect two rate cuts possible this year but beginning in July or possibly as late as September. All will depend on inflation and the growth rate. Surprise! Surprise! The cut to 4.5% may have to wait until Trump is in office (or in jail) ...  They say inflation's falling ... so far not fast enough. Headline inflation CPI basis eased to 3.2% in March from 3.4% prior month. Markets were disappointed. City analysts had expected a bigger drop. A fall to 3.1% had been expected. There's just no pleasing some folk.
Best not to look at the detail. Goods inflation fell to 0.8%. Service sector inflation eased to 6.0%. Add the two together and divide by two, headline inflation would have been recorded at 3.4%. Weight them effectively (Goods inflation 0.5099 and Service sector inflation 0.4900), the headline rate would have been 3.4%, down from 3.6% prior month. Disappointed by the drop to just 3.2%. Markets would freak at a real rate of 3.4%. As it was the Governor sought to allay concerns suggesting the numbers were in line with expectations. The Chancellor Jeremy Hunt suggested this was confirmation of a soft landing. "The economy has turned the corner. People are beginning to see that." "The plan is working. Inflation is falling faster than expected. It is down to the lowest level in nearly two and a half years." he said. The slower decline in inflation, reinforced speculation the Bank of England will leave rates higher for longer. Financial markets are beginning to think the first rate cut may not happen until November. That's a tough call. Ten year bond yields trade at 4.25 this morning up from 4.10 at close last week. Analysts think inflation will slip back to the official 2 per cent target in April, impacted by a reduction in the energy price cap. Ruth Gregory, deputy chief UK economist at Capital Economics said: "With utility prices set to fall by over 12. per cent in April, inflation will still just about fall below the 2 per cent target in the month." "As long as inflation continues to fall fast in the coming months as we expect, the Bank may still feel comfortable cutting interest rates in June." For the moment this remains our central outlook, with further cuts possible by end of the year, closing the year towards 4.5%. Comments from Andrew Bailey suggest the MPC is prepared to loosen monetary policy ahead of the Fed. "There is strong evidence, inflation is receding. The dynamics for inflation are different now between the UK and the USA." Hawks in the Bank will remain concerned about the high levels of service sector inflation and the latest earnings data. Average weekly earnings at 5.6% are incompatible with a 2% inflation target. Doves on the MPC will express concern about negative growth in the economy, sluggish retail sales, the slight rise in unemployment and the drop in vacancies. Food inflation eased to 3.9% in March and core inflation eased to 3.9% from 5.0%. As we said earlier this week, the bears are watching. Come the MPC meeting in June, the doves will hold sway. For scenario planners we caution, 4.5% base rates may well be the new benchmark. No return to Planet ZIRP. In the UK, prior to the Great Financial Crash [2000 - 2008] the average inflation rate was 2.0%, the average UK bank rate was 4.50%. Ten year gilt yields averaged 4.50%. Thirty year gilts averaged 4.60%. The average growth rate was 2.5%. The average unemployment rate was 5.0%. Earnings averaged 3.9%. This is our "return to the mean" outlook. 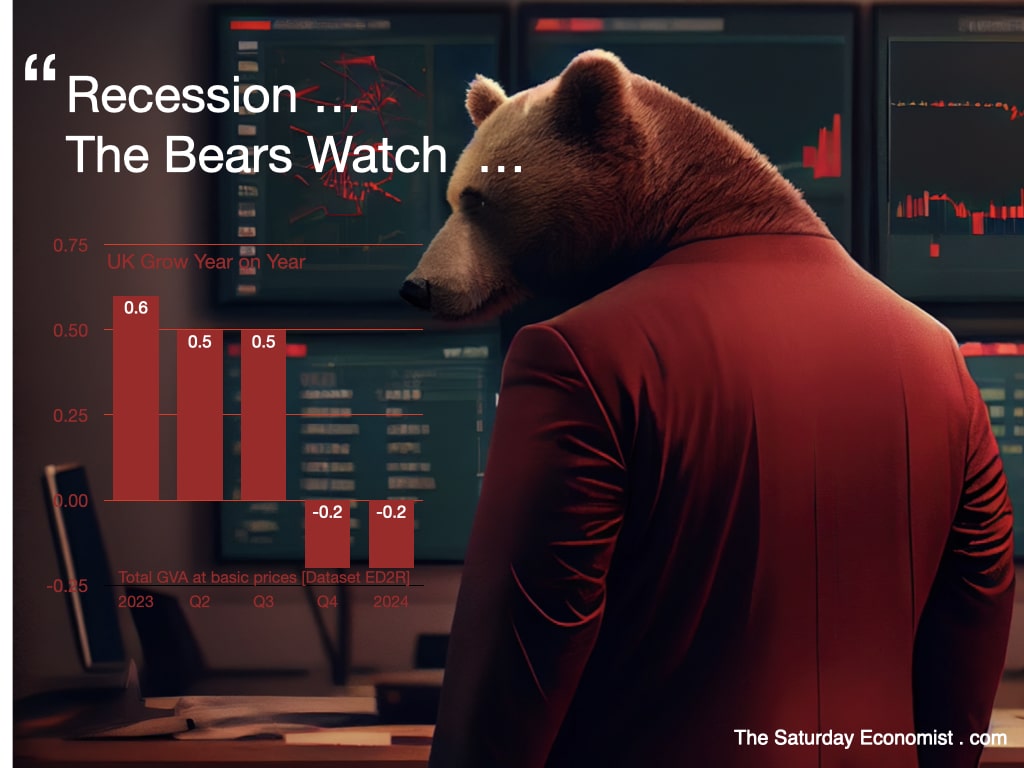 We have had a few days now to digest the latest GDP Data for the U.K. economy. It has taken a few days since, like the King of Siam …
"There are times, I almost think I am not sure, of what I know I very often find confusion in conclusion" Confusion was compounded this weekend by headlines which appeared to suggest the UK was escaping from recession, after set backs in the third and fourth quarters of 2023. Indeed the ONS commentary was upbeat. Real gross domestic product (GDP) is estimated to have grown by 0.2% in the three months to February 2024, compared with the three months to November 2023. It is confusing. I have concluded there is confusion in conclusion. There is a fashion to report growth as a month on month, or quarter on quarter, phenomenon. Call me old fashioned but the valid conventional measure of growth is year on year and not quarter on quarter. The data set [ED2R GVA at basis prices] confirms year on year, growth slowed from 0.6% in Q1 last year to 0.5% in Q2 and Q3, before slipping to -0.2% in the final quarter. The data suggests growth in January was down by -0.1% and down by -0.2% in February. The bears are watching. Barring a bounce back in March, the first quarter of the year, will confirm the UK is in recession, with two successive quarters of negative growth year on year. Slipping into recession, no turning the corner, no light at the end of the tunnel, no dawn of recovery, no green shoots, no bouncing back, no storm passing. The Prime Minister may think “Wages are up. Energy bills are falling. Pensions are going up. Tax cuts are now already happening and benefiting people. The chancellor may think we are "Breaking Through The Clouds" when he set out his vision for long-term prosperity in the UK, optimism despite economic headwinds. Hunt may believe the economy is "back on track". He has rejected the "gloom" about the UK's economic prospects and declaring "declinism about Britain is just wrong." Both Hunt and Sunak should take a hard look at just what happened in the final quarter of last year. There was some good news. Education and healthcare were up by almost 2%. Manufacturing output was up by over 1.2%. But construction output fell by -0.5%, retail and distribution was down by almost 1%. Accommodation and food down by 1.5%. Transport and storage down by over 3%. Into the first quarter of 2025 and the poor performance of the service sector continues, falling by 0.3% year on year. The latest jobs data suggest the unemployment rate is rising as vacancies continue to fall. The bright spot, the arts and entertainment sector is growing by over 6.5% this quarter compared to almost 5% in the last quarter of the prior year. Which just goes to show the information should all be shared with a pinch of uncertainty. Let’s hope we are back on track and breaking through the clouds. Technically we are in recession and the bears are watching ...  One of the world's richest people and the head of the nation's largest bank, join a group of business executives making bold prognostications about the potential of artificial intelligence, according to the Wall Street Journal last week.
Elon Musk and Jamie Dimon both say artificial intelligence could usher in dramatic change. It will be smarter than humans, transform society and surpass the collective intelligence of mankind in five years. "My guess is that we will have AI that is smarter than any human probably around the end of next year," Musk said in a recent interview. "AI is the fastest-advancing technology I have ever seen." Jamie Dimon, chief executive of JPMorgan Chase, told investors Monday that AI could be as transformative as some of the major technological inventions over the past several hundred years. "Think the printing press, the steam engine, electricity, computing and the Internet, among others," Dimon wrote in his annual letter to shareholders. "The AI race to build the next big thing has sparked a talent war in Silicon Valley. Tech companies have poured cash into AI at a breakneck pace." Google Chief Executive Sundar Pichai has said AI could be more profound than the invention of fire or electricity. Vinod Khosla, founder of venture-capital firm Khosla Ventures, declared last year that within 10 years, AI will take on "80% of the jobs that exist today." "The need to work in society will disappear within 25 years for those countries that adapt these technologies," Khosla said in an interview with The Wall Street Journal. The technology has also led to stark warnings about the future of humanity. Earlier this week, Japan's largest telecommunications company and the country's biggest newspaper cautioned in a manifesto unless AI is restrained, democracy and social order could collapse. In the U.S., the Biden administration last year invoked emergency federal powers to compel major AI companies to notify the government when developing systems that pose a serious risk to national security. Some say predictions of AI's transformative powers have been overblown. Gary Marcus, a cognitive scientist who sold an AI startup to Uber in 2016, said generative AI may one day approach a level where it can transform society, but there has to be vast improvements to approach the level of change produced by the internet or even smartphones. "Generative AI programs currently make too many mistakes, are unreliable and have a superficial understanding of the world," Marcus said. "It is implausible that AI will approach human intelligence by the end of next year. Surpassing all of human intelligence in the next five years is also far-fetched", he said. Marcus offered to wager $1 million with Musk that his prediction of AI becoming smarter than a human by next year turns out to be wrong. Damion Hankejh, chief executive of Ingk, a startup semiconductor company, says he is bullish on the future of AI, saying it will be the next tech renaissance. But he doesn't think current AI systems will advance enough to surpass human intelligence. It's never going to happen," Hankejh said."Digital math machines aren't brains." "There's a lot of hype in AI right now," says Angel Vossough, the co-founder and chief executive of BetterAI. "AI systems are good at analyzing large data sets, and can make predictions or speed up productivity. But they are nowhere near being as intelligent as humans", she said, "a big part of human intelligence is emotional intelligence." "AI needs to connect, understand and respond to human emotions in a way that actually feels authentic and meaningful" she said. "I don't think we are anywhere close." How To Organise for AI ... Just Say CAIO ... Chief AI officer CAIO is one of the hottest new job titles but some say AI strategy should be everyone's job. Many organizations have decided that AI is too important and complicated to rely on one executive to develop and manage their strategy. Organizations raced to develop AI ideas and leadership in 2023. President Biden ordered every federal agency to hire a chief AI officer (CAIO) by the start of 2024. Imagine that a CAIO in every government department in the UK. It could even lead to an end to fax machines in the NHS ... That's all for now. Let me know what you think. Have a great week ahead ... References Elon Musk and Jamie Dimon's AI Predictions and What They Mean for the Future of Humanity - Wall Street Journal. Joseph De Avila. 10th April 2024. Dimensions of Strategy on Artificial Intelligence ... our own series  Hey Buddy Can You Spare A Dime ... Or Make That Half a Billion Dollars ...
I guess we have all been there.. You start the week struggling to find half a billion dollars, then suddenly six come all at once. Better than real estate, the Trump fortunes were boosted by a social media maxi-meme valued, at one stage last week, at over $10 billion dollars. The move valued DJT's personal stake at $6 billion, catapulting Donald Trump into the top billionaires list ranking alongside George Lucas and Georgio Armani. They say you can't beat the market. You can't beat a social media application and nothing beats a maxi-meme. It's much more fun than real estate. You don't have to dress the figures or overstate the floor space. The market's imagination and momentum does the job. Trump's Media & Technology Group Corp. [TMTG], the main product of which is Truth Social, has been absorbed into Digital World Acquisition Company. DWAC is a SPAC, we hope its not a dog but more on that later. The initial share deal valued TMTG at $875 billion. Not bad for a business, which reported a net loss of $58 million in 2023, with total revenue of $4.1 million in that time. Not bad for a business which brings in little revenue, posts zero profit and has no indication it has a path to profitability that would justify a valuation of almost $1 billion, let alone a valuation of over $10 billion which the stock hit in the first week of trading. Not bad for a business which did not provide the Digital World Board with financial projections in connection with the due diligence process. Not bad for a business which has identified a material weakness in its internal control over financial reporting. The acquisition prospectus explains, Digital World may not be able to accurately report its financial results in a timely manner, which may adversely affect investor confidence and materially and adversely affect business and operating results. Not bad for a business which does not currently, and may never, collect, monitor or report certain key operating metrics used by companies in similar industries. KPIs like sign ups, average revenue per user, ad impressions, monthly and daily active users. That sort of thing. Why not? The prospectus explains, "Since its inception, TMTG has focused on developing Truth Social by enhancing features and user interface rather than relying on traditional performance metrics." "While many industry peers may gather and report on these or similar metrics, given the early development stage of the TMTG platform, TMTG's management and board has not relied on any particular key performance metric to make business or operating decisions." "At this juncture in its development, TMTG believes that adhering to traditional key performance indicators, could potentially divert its focus from strategic evaluation with respect to the progress and growth of its business." "TMTG believes that focusing on these KPIs might not align with the best interests of TMTG or its shareholders, as it could lead to short-term decision-making at the expense of long-term innovation and value creation. No short-termism in the TMTG board room. Well there you have it. No short-termism in the TMTG board room. Working for the long term to justify the market faith in the business. Presumably advertisers will have to take the performance figures in good faith or be prepared to lob a bit of cash into the Donald Trump coffers to make good the revenue targets. Not bad for a business which cannot assure investors that TMTG will effectively manage TMTG's growth. If TMTG fails to effectively manage its growth, business and operating results could be harmed. Another warning. Page 126 Prospectus. Not bad for a business which is now a Donald Trump company. The prospectus warns there are a number of companies that were associated with President Trump have filed for bankruptcy, including one with a DJT Ticker. The ticker symbol "DJT" was also previously used by Trump's Atlantic City casino business, Trump Hotels and Casino Resorts, which went public in 1995 and eventually filed for bankruptcy in 2004. The prospectus warns, there can be no assurances that TMTG will not also become bankrupt. The use once again of the DJT Ticker for TMTG, may well serve as a mega-warning from a mega-meme. I could have been so different. DWAC considered fifteen different deals in view of delays with TMTG. The Prospectus reveals Digital World sent an NDA to Target B, an American pet care company offering a technology platform to enable on-demand and scheduled dog walking, training, and other pet care services. In the end target B walked with another suitor. So there you have it. DWAC could have morphed into a doggie app. Cynics argue, there's time yet. Doggie App or Maxi Meme? Post Note ... DJT closed at $48.66 last night, down 40% from peak last week as the company announced "TMTG expects to incur operating losses for the foreseeable future," according to yesterday's filing with the Securities and Exchange Commission. ------------------------------------------------------------------------------- Notes On The Art Of The Deal ... Digital World [DWAC] Digital World [DWAC] is a special purpose acquisition company [SPAC] formed for the purpose of effecting a merger, capital stock exchange, asset acquisition, stock purchase, reorganisation or similar business combination with one or more businesses. Digital World was incorporated under the laws of the State of Delaware on December 11, 2020. In September 2021, the SPAC raised approximately $300 million dollars by the issuance of around 30 million shares marked at $10 dollars per share. Trump Media & Technology Group Corp. [TMTG] Trump Media & Technology Group Corp. [TMTG] is a Delaware corporation which aspires to build a media and technology powerhouse to rival the liberal media consortium and promote free expression. TMTG was founded to fight back against the big tech companies, Meta (Facebook, Instagram and Threads), X (formerly Twitter), Netflix, Alphabet (Google), Amazon and others. TMTG was incorporated under the laws of the State of Delaware on February 8, 2021. TMTG's first product, Truth Social, is a social media platform aiming to disrupt big tech's control on free speech by opening up the Internet and giving the American people their voices back. Truth Social was generally made available in the first quarter of 2022. Valuation At the time of valuation, the median enterprise value of the available "Trading Comparables" surpassed $324 billion. Specifically, the enterprise value of Twitter (now known as X), the closest competitor to TMTG's initial product, Truth Social, was $41 billion. Therefore, at such time, Digital World's management concluded that an initial valuation of $875 million, with the potential for an additional earnout of $825 million, was a reasonable assessment for TMTG's enterprise valuation in the Business Combination transaction.  Inflation Set To Fall ... Interest Rates Set To Follow ...
Bond yields rallied, Sterling slipped against the Dollar this week. The latest US inflation suggests CPI is heading higher. Analysts are beginning to rethink, the forward outlook for US interest rates and the actions of the Federal Reserve. It doesn't take much to spook markets. Uncle Sam's CPI inflation increased to 3.2 per cent in February from 3.1 per cent prior month. Producer prices increased to 1.6 per cent in February, up from 1 per cent in January and 0.8 per cent in November last year. Markets moved. Ten year bond yields increased to 4.31% in the U.S. and 4.10% in the U.K. Sterling slipped from $1.29 to $1.27. When it comes to understanding market moves, "Any explanation is better than none" (Nietzsche). In the U.K. We won't have to wait long for an update. The MPC is set to meet this week. A decision on UK rates due Thursday. The latest inflation data is due on Wednesday. This will give some steer to the direction of travel on prices and base rates. So what to expect? Market forecasts suggest consumer price inflation will have fallen from 4 per cent in January to 3.5 per cent last month. This, on the back of slowing food and energy prices. Core inflation, excluding food and energy, is expected to have eased from 5.1 per cent to around 4.5 per cent. Strong disinflationary pressures and tight monetary policy may cause inflation to fall below the 2 per cent target this year. The Office for Budget Responsibility produced new forecasts this month. They indicate inflation will hit the 2 per cent target in the second quarter and will stay below target for the rest of the year, ending the year at 1.4 per cent. The Bank of England forecasts suggest inflation will hit the 2 per cent target in the second quarter but inflation is expected to rise in the second half of 2024. Inflation will end the year a 2.8%, meeting the 2 per cent target only in 2025, the Bank said. Falling food prices and energy costs the critical drivers. Intervention of the Ofgem price caps of great assistance in April. The rosy coloured outlook for inflation may not be so easy to achieve. Oil prices Brent Crude averaged $83.48 dollars in February compared to $82.59 last year. Prices averaged $75 dollars in May and June 2023. The latest earnings data suggest whole economy earnings were 5.6 per cent in January (6.1 per cent excluding bonuses). Moving in the right direction but as yet incompatible with the 2 per cent target. Service sector inflation, accounting for almost half the index, increased to 6.5 per cent in January, up from 6.3% in November. So we await with interest, the February figures for inflation. Some steer on what happens next with Base Rates may then follow. Bank of England Interest Rate Decision ... There is little or no expectation the Bank of England will lower rates this week. Rates on hold the probable decision. The only excitement, the voting mix, "stick or twist". As David Smith writing in the Sunday Times this week points out ... "It is now more than seven months since the MPC last changed interest rates.. It would be a big surprise if there is not another hold this week. That does not mean that there will be no interest in Thursday's decision. Last month, one member of the committee, Swati Dhingra, voted to cut, while two members, Catherine Mann and Jonathan Haskel, voted to raise rates. The other six were happy to leave things unchanged. Some of the speculation this week is therefore, whether anybody else joins Dhingra in voting for a cut rates, which at this stage is considered unlikely, and whether Mann and Haskel throw in the towel on further rate rises." So when will there be a cut in rates? Following this week's meeting, the MPC will have five more meetings and five more opportunities to cut interest rates this year. Markets think May is too early. June is favoured for the first cut of 25 basis points. August, September, November and December are the remaining meetings scheduled this year. December too close to Christmas. November too close to an election, if he makes it that far! We anticipate base rates at 4.5 per cent by the end of the year. That would suggest rates cuts possible in August and September but not much more to follow in 2025 . In the UK, prior to the Great Financial Crash [2000 - 2008] the average inflation rate was 2.0%, the average UK bank rate was 4.50%. Ten year gilt yields averaged 4.50%, real GDP growth averaged 2.5%, earnings averaged 3.5%, the unemployment rate averaged 5%. As always, "'The Committee would be prepared to adjust the stance of monetary policy as appropriate if risks emerge that could impede the attainment of the Committee's goals." Oops, that's the Fed, not the Old Lady, talking. |
The Saturday EconomistAuthorJohn Ashcroft publishes the Saturday Economist. Join the mailing list for updates on the UK and World Economy. Archives
July 2024
Categories
All
|
| The Saturday Economist |
 RSS Feed
The material is based upon information which we consider to be reliable but we do not represent that it is accurate or complete and it should not be relied upon as such. We accept no liability for errors, or omissions of opinion or fact. In particular, no reliance should be placed on the comments on trends in financial markets. The presentation should not be construed as the giving of investment advice.
|
The Saturday Economist, weekly updates on the UK economy.
Sign Up Now! Stay Up To Date! | Privacy Policy | Terms and Conditions | |