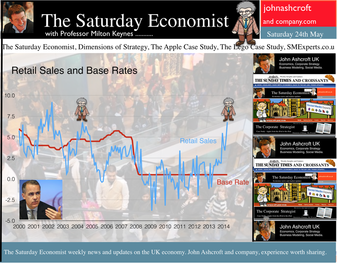
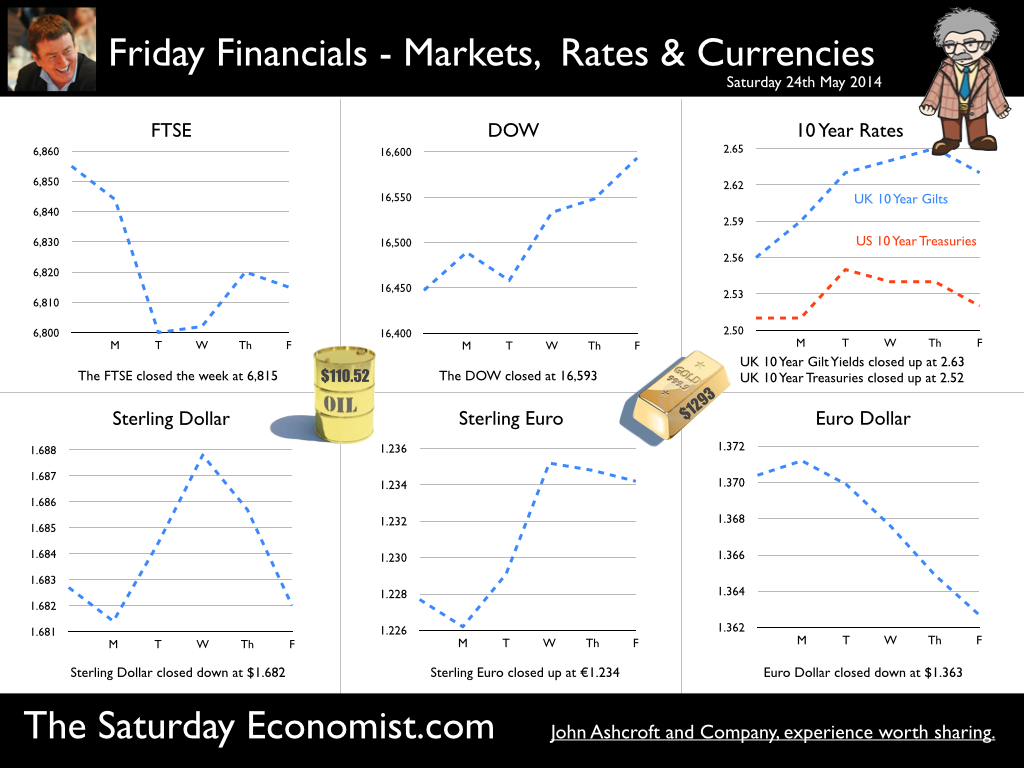
 It was one of those heavy weeks for economics releases. Inflation, retail sales, government borrowing plus the eagerly awaited second estimate of GDP. Add in ONS house price information and a heady cocktail of excited headlines was to be expected from the financial pages. Inflation data as expected … It began quietly enough with the inflation data. No surprises, CPI inflation edged up to 1.8% in April from 1.6% in the prior month. The large rise in service sector inflation to 2.8% from 2.3% was offset by a small decline in goods inflation, falling to 0.9% from 1.0%. The uptick was marginally reflected in producer prices, increasing to 0.6% from 0.5%. The more volatile input costs, fell at a slower rate -5.5%, from -6.3% prior month. Energy and oil prices, were again significant in the reduced input costs. Imported metals, chemicals, parts and equipment fell significantly assisted by the 10% appreciation of sterling against the dollar. For the year as a whole, we think inflation will hover close to the target for the best part of the year. The risk remains to the upside in the final quarter. A rise in international prices, and domestic demand, boosted by compression in the labour market is likely to push prices higher. No risk of deflation on the UK horizon, a real risk to the upside is developing. House Prices .. UK house prices increased, according to the ONS data, by 8% in the twelve months to March. “The house market may derail the recovery", the headline. “Carney believes that house prices are the biggest risk to the economy” the great caution. No matter, that house prices increased by over 9% in the prior month or that house prices outside London are increasing by just 4% on average. In the North West prices increased by just over 3%, in Scotland prices hardly increased at all. In London, house prices increased by 17%. Foreign cash buyers at the top end of the market may be confusing the overall trend. However, significant volume and price escalation in the mid tier market is also impacting on price averages. Governor Carney has made it clear interest rates will not rise to combat rising house prices. The remit to action lies with the Financial Policy Committee. Already, action has already been taken to modify the Funding for Lending Scheme away from mortgage lending. Discussions between the Bank and Treasury will continue to consider modifications to the “Help to Buy Scheme”. Implementation of the Mortgage Market Review will also curb lending into 2014. There is a structural problem in the housing market. Mark Carney, Governor of Threadneedle Street, points out that Canada has half the population of the UK but builds twice as many houses. No wonder there is a supply issue. But is the Bank of England prepared to help out? Not really. The Little Old Lady will not turn a sod, grab a hod nor build a single house this year. “We are not in the business of building houses” the Governor’s mantra. The Bank of England will not build a single house in this cycle but neither will it allow the housing market to derail the recovery, provoking a premature move in base rates. Retail Sales … Retail sales figures, on the other hand, suggest rates may have to rise much sooner than expected. Retail sales volumes increased by 6.8% in April compared to prior year. It was May 2004 when retail sales volumes increased at a similar rate. Base rates were 4.75% at the time rising to over 5% within eighteen months. Retail sales values increased by just over 6%. Online sales increased by 13%, accounting for 11% of total action. Consumer confidence is back to the pre recession levels, car sales are up by 8% this year and retail sales are soaring. From a UK perspective, rates should be on the move by the Autumn of this year. The MPC will be reluctant to move ahead of the Fed and the ECB. The international context suggests the rate rise may be delayed until the second quarter of 2015. Thereafter, for those who would argue the forward horizon has 2.5% cap, the retail sales figures and base rate history should provide a warning of surprises to come. GDP Second Estimate … No surprises in the second estimate of GDP release for Q1. No revisions. The UK economy grew by 3.1% boosted by an 8% surge in investment activity. Manufacturing and Construction increased by over 3% and 5% respectively. The economy is rebalancing … well a little bit! Our May Quarterly Economics Update on behalf of GM Chamber of Commerce is released next week. The outlook for the year remains broadly unchanged. We expect the UK economy to grow by around 3% this year and 2.8% in the following year. The surge in retail activity has been a surprise, as is the continued strength in employment. The outlook remains much the same. Growth up, inflation rising slightly, employment increasing and borrowing, despite the blip in April, set to fall. Just the trade figures will continue to disappoint as we have long pointed out. So what happened to sterling? The pound closed broadly unchanged against the dollar at $1.682 from $1.683 and up against the Euro at 1.234 (1.227). The dollar closed at 1.363 from 1.370 against the euro and at 101.97 (101.54) against the Yen. Oil Price Brent Crude closed up at $110.52 from $109.91. The average price in May last year was $102.3. Markets, the Dow closed up at 16,593 from 16,447 but the FTSE adjusted to 6,815 from 6,855. The markets are set to move, the push before the summer rush perhaps. UK Ten year gilt yields closed at 2.63 (2.56 and US Treasury yields closed at 2.52 from 2.51. Gold was unchanged at $1,293 from $1,293. That’s all for this week. Join the mailing list for The Saturday Economist or forward to a friend. John © 2014 The Saturday Economist by John Ashcroft and Company. Experience worth sharing. The material is based upon information which we consider to be reliable but we do not represent that it is accurate or complete and it should not be relied upon as such. We accept no liability for errors, or omissions of opinion or fact. In particular, no reliance should be placed on the comments on trends in financial markets. The receipt of this email should not be construed as the giving of investment advice.
0 Comments
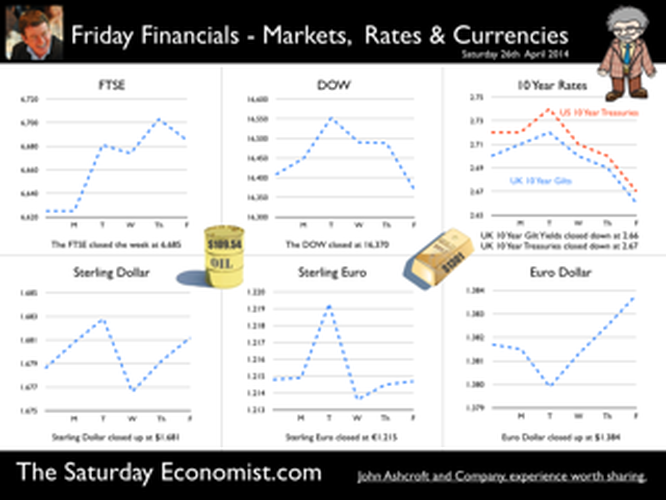
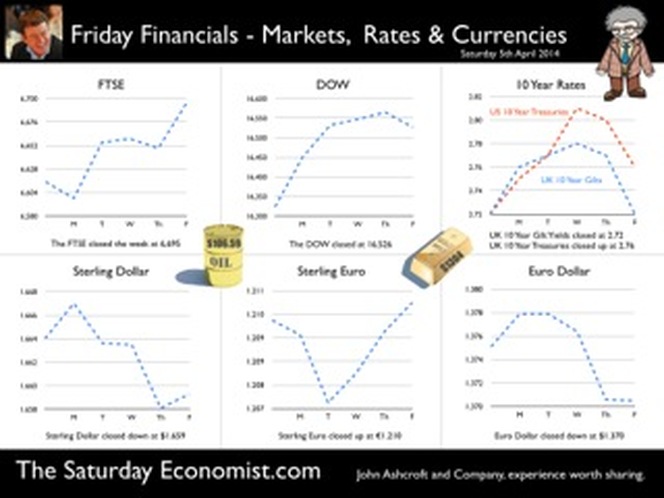
 Next week the ONS will release the first estimate of GDP for Q1 2014. Expectations are for growth in the UK to be between 3% and 3.3% for the first three months of the year. The UK will be the fastest growing country in the developed world. A soggy start to the year may have damaged hopes in Washington to a claim on the title. Our own forecasts, realised last month, are at the bottom end of the range at just 3%. The Chancellor is creating a great platform in the run up to the election. Growth up, inflation down, employment up, borrowing down. Just the trade figures will continue to disappoint. The Osborne model for “austerity in recovery” may provide the textbook examples for the revisionist theory in the years to come. Four out of five rabbits ain’t so bad! The good news continued this week … Car Manufacturing According to the SMMT, car manufacturing picked up the pace in March as home and export markets improved significantly. UK car production rose 12% in the month to 142,158 units, bringing year to date growth to 2.9%. Good news for the UK’s volume manufacturers as European demand for cars strengthens. Not so good for the balance of payments. The growth in output will do little to offset the strength in domestic sales. New car registrations increased by 14% in the first three months of the year. Government Borrowing Better news on borrowing. Public sector borrowing totalled £107.7bn in the financial year. The out turn is £7.5bn lower than the £115.1bn borrowed in the prior year. Receipts were up by 4% with expenditure increasing by just 1%. The trend is heading in the right direction. The OBR expect borrowing to fall to £95 billion over the next twelve months and £75 billion in the following year. At the end of March 2014, public sector debt excluding temporary effects of financial interventions was £1,268.7 billion, equivalent to 75.8% of gross domestic product. Net debt has doubled since the end of the 2008/9 financial year. Retail Sales Even better news. Retail sales in March increased by 4.2% in volume and by 3.9% in value terms. Average prices of goods sold in March 2014 showed deflation of 0.5%. Fuel once again provided the greatest contribution to the fall in prices. The figures are consistent with the latest CPI data. But as we warned last week, oil prices Brent Crude Basis are now tracking ahead of last years levels for April and May. The deflationary shock may well be over. Domestic earnings are rising and world commodity prices are turning as the world and European recovery particularly, gathers momentum. Online sales were strong once again. The amount spent online increased by 7.1% in March 2014 compared with March last year. On line sales now account for almost 11% of total sales with a marked growth in food sales on line, increasing by almost 14%. Corporate Strategy Series Watch out for our Amazon case study coming soon. Over the Easter holidays, we released the second in our international corporate strategy series. The LEGO case study, follows on from the Apple Case Study originally developed for the Business School in Manchester. The third in the trilogy, Amazon will be released next month. Amazon is a great case study in how to grow (or how not to grow) an online business. Amazon with losses in 2000 of $1.4 billion on sales of $2.8 billion is probably the greatest example yet of a turnaround from burn rate to earn rate. How long can the Amazon model continue to grow? Is there much point in delivering salads in Seattle as part of the Amazon Fresh programme? Watch out for news of the release date.] So what happened to sterling this week? The pound closed up against the dollar at $1.681 from $1.679 and unchanged at 1.215 against the Euro. The dollar closed at 1.382 from 1.382 against the euro and at 102.15 (102.42) against the Yen. Oil Price Brent Crude closed at $109.54 from $109.76. The average price in April last year was $101.2. Markets, the Dow closed down slightly at 16,370 from 16,408 and the FTSE also closed up at 6,685 from 6,625. The markets will have to rally soon, if we are to sell in May and go away! UK Ten year gilt yields closed at 2.66 (2.70) and US Treasury yields closed at 2.67 from 2.72. Gold moved up to $1,301 from $1,293. That’s all for this week. Join the mailing list for The Saturday Economist or forward to a friend. John © 2014 The Saturday Economist by John Ashcroft and Company. Experience worth sharing. The material is based upon information which we consider to be reliable but we do not represent that it is accurate or complete and it should not be relied upon as such. We accept no liability for errors, or omissions of opinion or fact. In particular, no reliance should be placed on the comments on trends in financial markets. The receipt of this email should not be construed as the giving of investment advice.  Car sales soar but so will the trade deficit … Good news of the recovery. Car registrations rose to 465,000 in March, an increase of 18% on last year. The new 2014 plates have been great for the car market. More new cars were registered last month, than at any time in the last ten years according to the Society of Motor Manufacturers and Traders. As Mike Hawes, SMMT Chief Executive explains. “Given the past six years of subdued economic performance across the UK, there is still a substantial margin of pent-up demand, contributing to a strong new and used car market.” Easy finance deals and advanced technologies make new cars cheaper to buy and to run. There has never been a better time to buy a new car. The pent up demand is to be unleashed. Bear in mind, we have over 31 million cars on the road in the UK, of which over one third are over nine years old. Let’s hope the owners don’t all appear in the showroom at once.That would create a traffic jam at the docks. The car market demonstrates clearly the problems with the march of the makers, the rebalancing agenda and the inability of sterling depreciation to remedy the trade balance. We expect car sales to increase to around 2.5 million units in 2014 returning to levels last seen in 2004 and 2005. Production is forecast to increase to 1.6 million units following the increase to 1.5 million last year. A further increase to 1.7 million units, then 1.8 million units is expected by 2016. Good news for manufacturing? Of course. But the majority of production is exported. Export sales may hit 1.3 million units in 2014, rising to 1.5 million by 2016. As a result, imports will have to increase to 2.2 million units in 2014, rising to 2.4 million units by 2016 to satisfy domestic demand. The trade deficit (unit sales) will increase to 0.8 or 0.9 million units. An increase to levels least seen pre recession. The recovery in the UK economy will exacerbate the trade deficit in cars just as it will in many other commodities. Relative rates of economic growth here and particularly in Europe primarily determine the demand for imports and exports. Demand is relatively inelastic with regard to price, particularly with exports. Manufacturers price to market or products form part of international syndication. Sterling has a minor role to play in determining the direction of trade in the international car market. Supply, is output constrained and cannot respond to domestic market growth. In fact 80% of car production is exported and 90% of domestic demand is satisfied by imports. We have warned previously, the UK cannot grow faster than trade partners in Europe or North America without a deterioration in the trade account. The car market is a simple arithmetic of the dilemma. Download the short report Car Market - Driving recovery or driving the deficit to access the underlying data. PMI Markit Surveys This is the week of the PMI Markit survey data with information on the March updates. The recovery continues in services, construction and manufacturing. The manufacturing upturn remains solid, service sector activity remains strong and construction firms report brightest outlook for business activity since January 2007. We have upgraded our forecast for UK growth this year to 2.9% based on the strength of the Manchester Index® and latest GM Chamber of Commerce QES survey data. House Prices, Nationwide reports house prices increasing by 9.5% across the UK, increasing by 18% in London. Prices remain slightly below the peak levels of 2007 except in the capital, were levels are now some 20% above peak. Should we worry about the boom in prices? Perhaps but not just yet. Activity levels are still subdued relative to the pre recession peaks but the recovery in prices will be of concern to policy makers as will the developing trade deficit. In our economics presentations we begin to touch on concerns about the recovery. Deflation is not one of them, house prices may be. The current account deficit certainly is. Especially if the trends in investment income from overseas are maintained. Then we shall see just what will happen to sterling. So what happened to sterling this week? The pound closed at $1.659 from $1.664 and at 1.21 unchanged against the Euro. The dollar closed at 1.370 from 1.375 against the euro and at 103.26 from 102.82against the Yen. Oil Price Brent Crude closed at $106.72 from $108.01. The average price in March last year was $108. Markets, the Dow closed up at 16,526 from 16,323 and the FTSE closed at 6,6956 from 6,615. UK Ten year gilt yields closed at 2.72 (2.72) and US Treasury yields closed at 2.76 from 2.72. Gold moved higher to $1,304 from $1,293. That’s all for this week. Join the mailing list for The Saturday Economist or forward to a friend. John © 2014 The Saturday Economist by John Ashcroft and Company. Experience worth sharing. The material is based upon information which we consider to be reliable but we do not represent that it is accurate or complete and it should not be relied upon as such. We accept no liability for errors, or omissions of opinion or fact. In particular, no reliance should be placed on the comments on trends in financial markets. The receipt of this email should not be construed as the giving of investment advice. 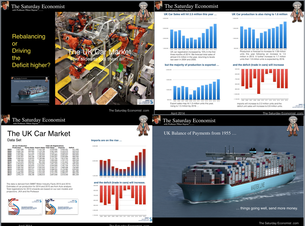 Good news in the car market but the higher level of sales will drive the trade deficit higher - no rebalancing on the road ahead. Download the file here. The new 14 plates have been great for the car market. Registrations in March were 465,000, up by 18% on March last year. UK car registration increased by 15% in the first three months of 2014. We forecast total sales of almost 2.5 million this year, returning to levels of sales, last seen in 2004 and 2005. Production is forecast to increase to 1.6 million units following the increase to 1.5 million last year. A further increase to 1.7 million units, then 1.8 million units is expected by 2016. Good news? Of course. But the majority of production is exported. Export sales may hit 1.3 million units in 2014, rising to 1.5 million by 2016. As a result, imports will have to increase to 2.2 million units in 2014, rising to 2.4 million units by 2016. The trade deficit (unit sales) will increase to 0.8 million units, to the levels least seen pre recession. The surge in car sales is a welcome demonstration of UK demand. As Mike Hawes, SMMT Chief Executive explains. “Given the past six years of subdued economic performance across the UK, there is still a substantial margin of pent-up demand that is contributing to a strong new and used car market.” The pent up demand is to be unleashed. Remember we have over 31 million cars on the road in the UK of which over one third are over nine years old. Easy finance deals and advanced technologies make new cars cheaper to buy and to run. There has never been a better time to buy a new car. Let’s hope they don’t all rush at once. That would create a traffic jam at the docks. That’s another reason why we say the trade figures will continue to disappoint, and threaten the recovery, especially if the collapse in investment income continues. Download the short report here. 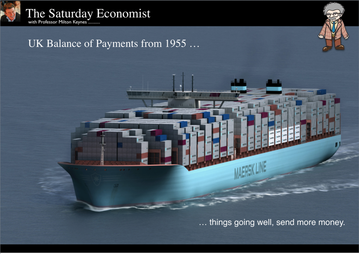 UK Balance of Payments 2013 - Current Account Deficit could be a real threat to recovery. Download the full report. In 2013, overseas investment earnings collapsed and the trade deficit persisted. The UK current account deficit was over 4% of GDP. This has happened in only two years since the 1950s. The first time was in 1974 and the second time was in 1989. In each of the two years, UK base rates were hiked to 12% and 14% respectively. In 1976 the IMF paid a visit to assist with funding. We do not know as yet if the fall in investment returns last year was a blip or a statistical error which may be reversed in due course. We do know that if the trends in investment income continue, the UK will face a balance of payments problem of Tsunami proportions. Capital outflows would become difficult to finance - international investors already own 30% of the gilt market and over 50% of quoted stocks. Forward guidance would be of little value in the enforced knee jerk reaction required. International - not domestic developments would force base rates higher. The Bank of England would have to act to prop up sterling. “A new generation of economists will have to come to grips with the terminology of a balance of payments crisis, a run on sterling and the concept of the balance of payments as a constraint to growth.” In this short report, we analyse the UK balance of payments from 1955 to the current day. Developments in the current account, particularly in investment income, if continued, will present a real challenge to recovery and growth in the UK. Download a copy of the report here. Download a copy of the Keynote Files Here. |
The Saturday EconomistAuthorJohn Ashcroft publishes the Saturday Economist. Join the mailing list for updates on the UK and World Economy. Archives
July 2024
Categories
All
|
| The Saturday Economist |
The material is based upon information which we consider to be reliable but we do not represent that it is accurate or complete and it should not be relied upon as such. We accept no liability for errors, or omissions of opinion or fact. In particular, no reliance should be placed on the comments on trends in financial markets. The presentation should not be construed as the giving of investment advice.
|
The Saturday Economist, weekly updates on the UK economy.
Sign Up Now! Stay Up To Date! | Privacy Policy | Terms and Conditions | |
 RSS Feed